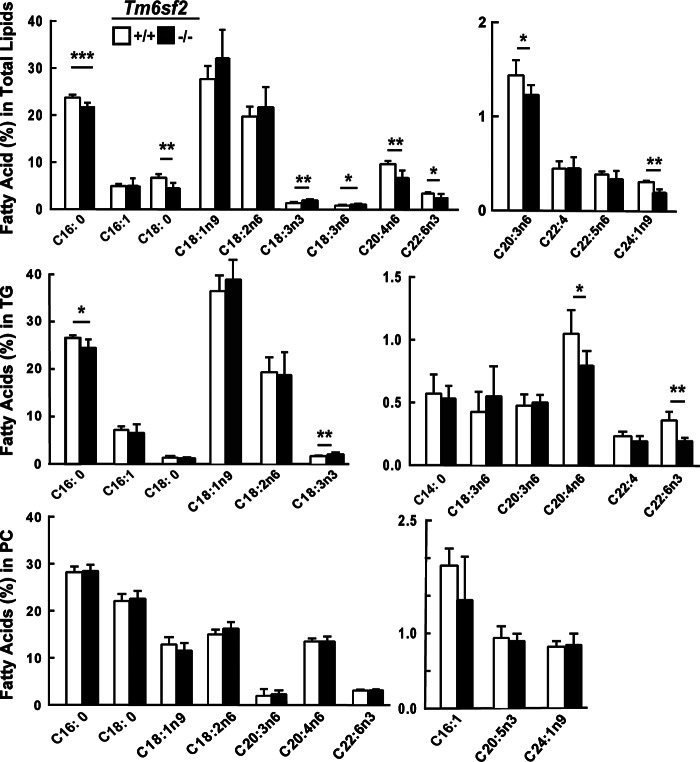
FIGURE 12.
Fatty acid composition of hepatic lipids in WT and Tm6sf2−/− mice. Livers were collected from chow-fed 13-week-old male mice (n = 5) after a 4-h fast. The TG and PC fractions were separated by thin layer chromatography (TLC), hydrolyzed, and derivatized with trimethylsilane. The fatty acid methyl-esters were quantified by GC. Each value represents the mean ± S.E. (error bars). *, p < 0.05; **, p < 0.01; ***, p < 0.001.

