FIGURE 3.
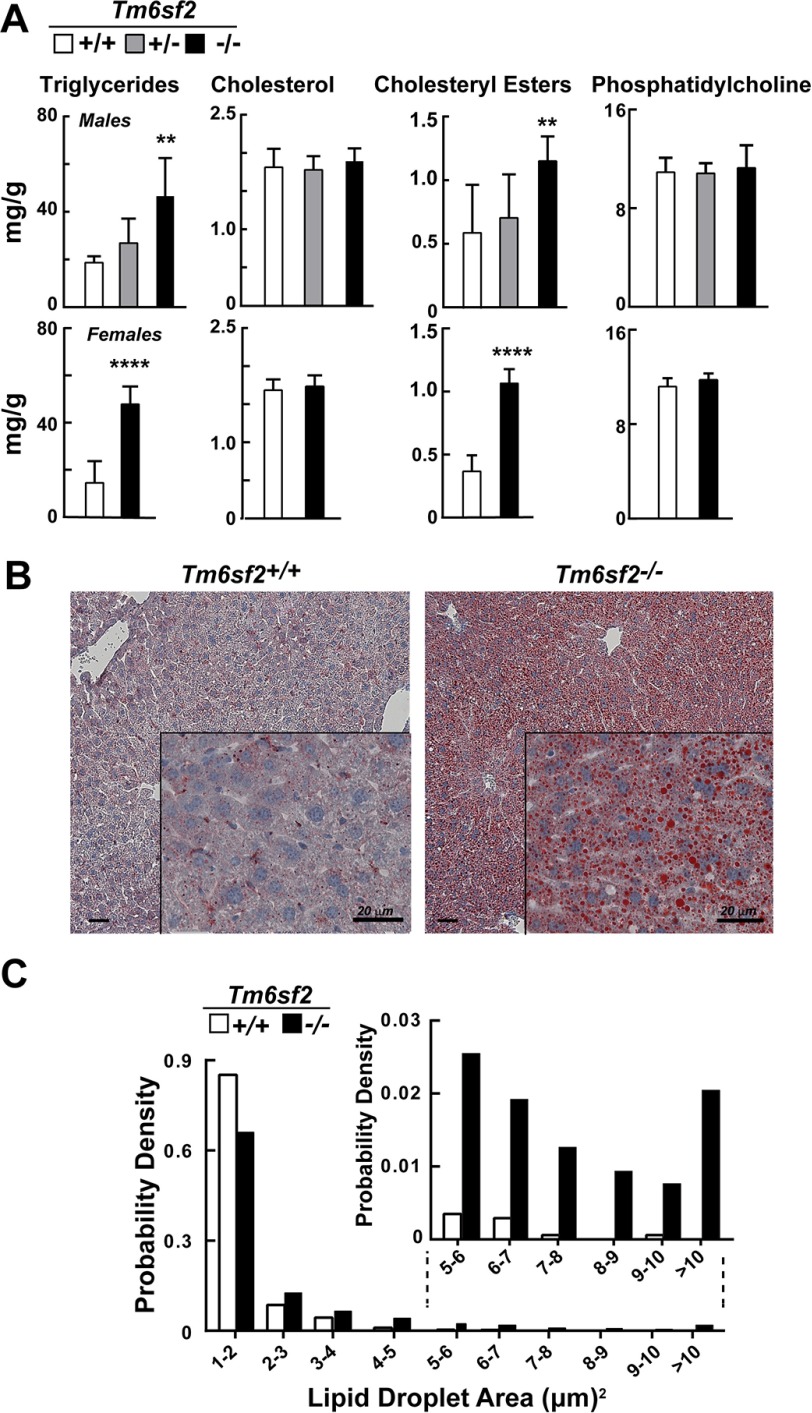
Hepatic lipid content and LD size distribution in Tm6sf2−/− mice. A, hepatic lipid levels were measured in 13-week-old chow-fed male mice (5 mice/group) (top) and 11-week-old female mice (6 mice/group) (bottom) using enzymatic assays. Bars, means ± S.E. (error bars). B, liver sections from WT and Tm6sf2−/− male mice from panel A were stained with Oil Red O and hematoxylin and visualized using a Leica microscope (DM2000) at ×10 and ×40 (inset) magnification. C, size distribution of male hepatic LDs in WT and KO mice. LD sizes were determined from images of Oil Red O-stained liver sections using ImageJ software as described under “Experimental Procedures.” The experiment was repeated twice, and the results were similar. **, p < 0.01; ****, p < 0.0001.

