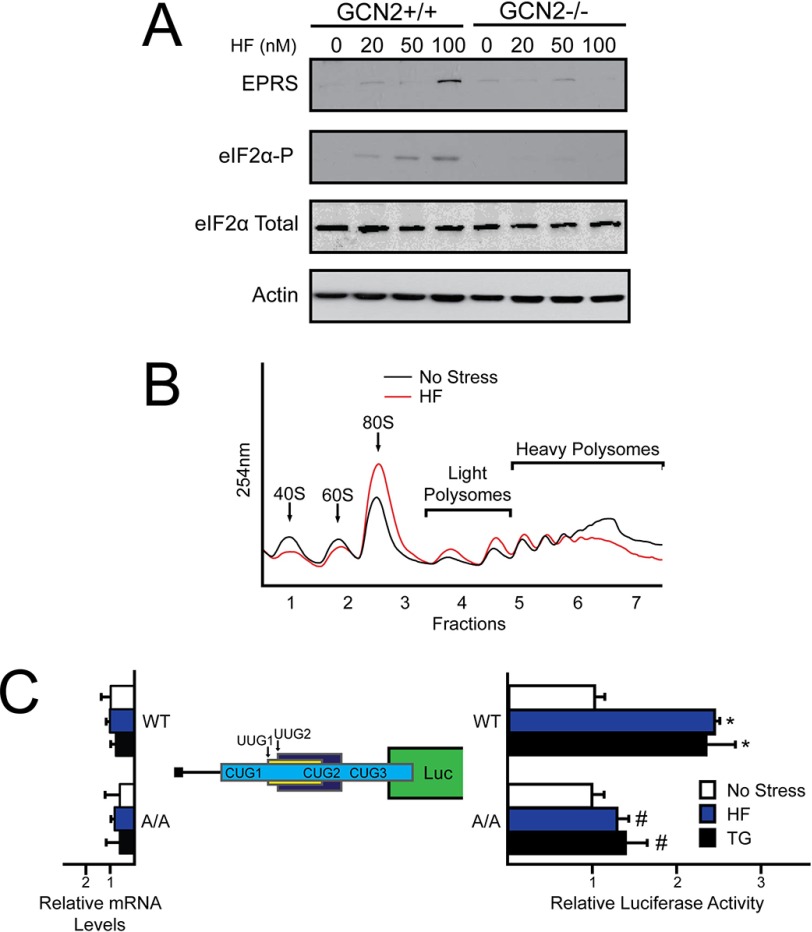
FIGURE 6.
EPRS translation control is regulated in response to halofuginone treatment. A, GCN2+/+ and GCN2−/− MEF cells were treated with increasing concentrations of halofuginone for 6 h. Protein lysates were processed, and the levels of EPRS, eIF2α-P, eIF2α total, and β-actin were measured by immunoblot. B, WT MEF cells were treated with halofuginone for 6 h or left untreated. Lysates were collected, sheared using a 23-gauge needle, and layered on to 10–50% sucrose gradients followed by ultracentrifugation and analysis of whole lysate polysome profiles at 254 nm. C, the PTK-EPRS-Luc construct and a Renilla luciferase reporter were co-transfected into WT or A/A MEFs and treated with thapsigargin or halofuginone for 6 h or left untreated. EPRS 5′-leader mediated translation control was measured via Dual-Luciferase assay and corresponding EPRS-Luc mRNA values were measured by qRT-PCR. The relative values are represented as histograms for each with the S.D. indicated. HF, halofuginone; TG, thapsigargin.

