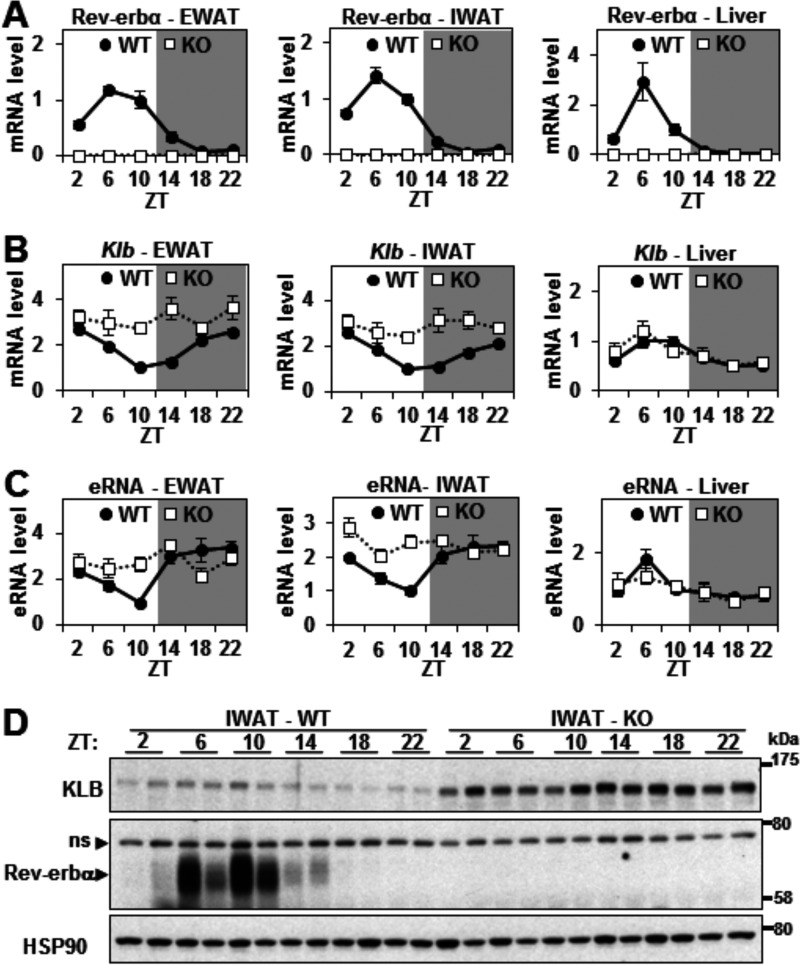
FIGURE 4.
Rev-erbα controls the circadian transcription of Klb in WAT. A and B, relative mRNA levels of Rev-erbα (A) and Klb (B) in EWAT, IWAT, and liver of WT and Rev-erbα KO mice throughout 24 h. Values are the mean ± S.E. and normalized to the WT at ZT 10 (n = 4–6/time point). C, RT-qPCR of eRNA at the Klb locus in EWAT, IWAT, and liver of WT and Rev-erbα KO mice throughout 24 h. Data are expressed as the mean ± S.E. (n = 4–6/time point) and normalized to the WT at ZT 10. D, Western blotting analysis of KLB, Rev-erbα (ns, nonspecific band), and HSP90 (loading control) protein levels in IWAT of WT and Rev-erbα KO mice throughout 24 h (n = 2/time point). Representative immunoblots are presented.

