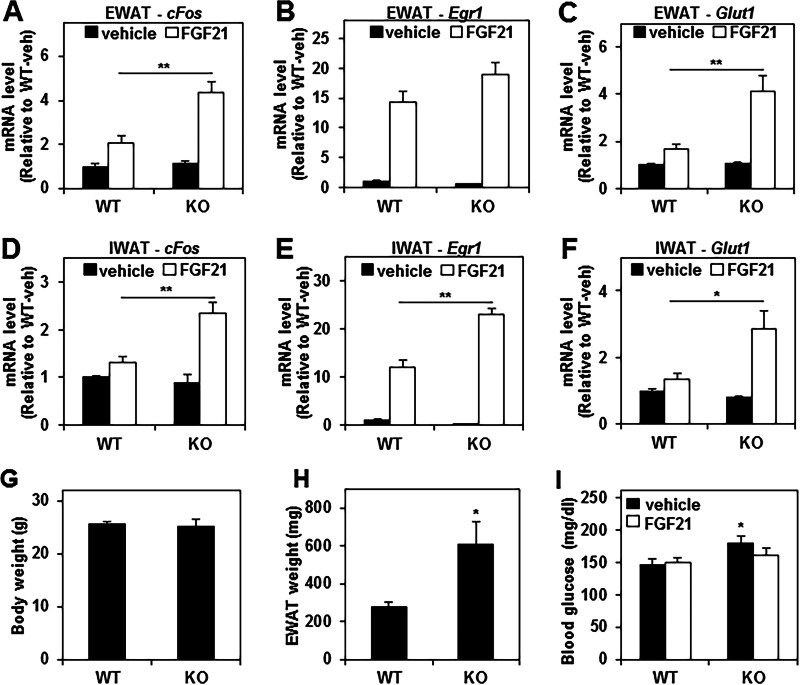
FIGURE 6.
The FGF21 response is enhanced in white adipose tissue of Rev-erbα KO mice. A–F, relative mRNA levels of the FGF21 target genes cFos, Egr1, and Glut1 in EWAT (A–C) and IWAT (D--F) of WT and Rev-erbα KO mice injected with either vehicle or 0.6 mg/kg FGF21. Tissues were harvested at ZT 10, 2 h after the injection. Values are expressed as the mean ± S.E. and normalized to WT vehicle (two-way analysis of variance and Tukey's post hoc test; *, p < 0.01; **, p < 0.001; n = 8). G and H, body weight (G) and EWAT weight (H) of WT and Rev-erbα KO mice. Data are expressed as the mean ± S.E. (Student's t test; *, p < 0.05 versus WT; n = 5). I, blood glucose level of WT and Rev-erbα KO mice injected with either vehicle or 0.6 mg/kg of FGF21. Blood was collected at ZT 10, 2 h after the injection. Data are expressed as the mean ± S.E. (two-way analysis of variance; *, p < 0.05 versus WT vehicle; n = 6).

