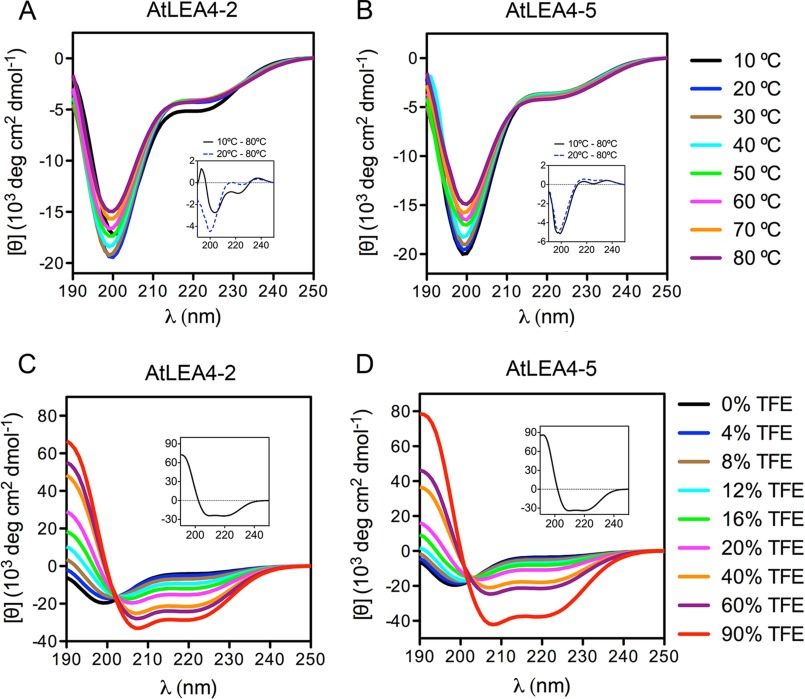
FIGURE 2.
Far UV CD spectra of AtLEA4-2 and AtLEA4-5 in aqueous solution at various temperatures and in different TFE concentrations. A and B, far UV CD spectra of AtLEA4-2 (A) and AtLEA4-5 (B) at 10 °C (black), 20 °C (blue), 30 °C (brown), 40 °C (cyan), 50 °C (green), 60 °C (magenta), 70 °C (orange), and 80 °C (purple). Insets in A and B show Δ10–80 °C (continuous black line) and Δ20–80 °C (dashed blue line) difference spectra. C and D, AtLEA4-2 (C) and AtLEA4-5 (D) in TFE/water mixtures at 0% (black), 4% (blue), 8% (brown), 12% (cyan), 16% (green), 20% (magenta), 40% (orange), 60% (purple), and 90% (red) TFE. The difference spectra (Δ90–0% TFE) are shown as insets in C and D. These results were reproduced at least four times in autonomous experiments, using three independent purification batches of both proteins.

