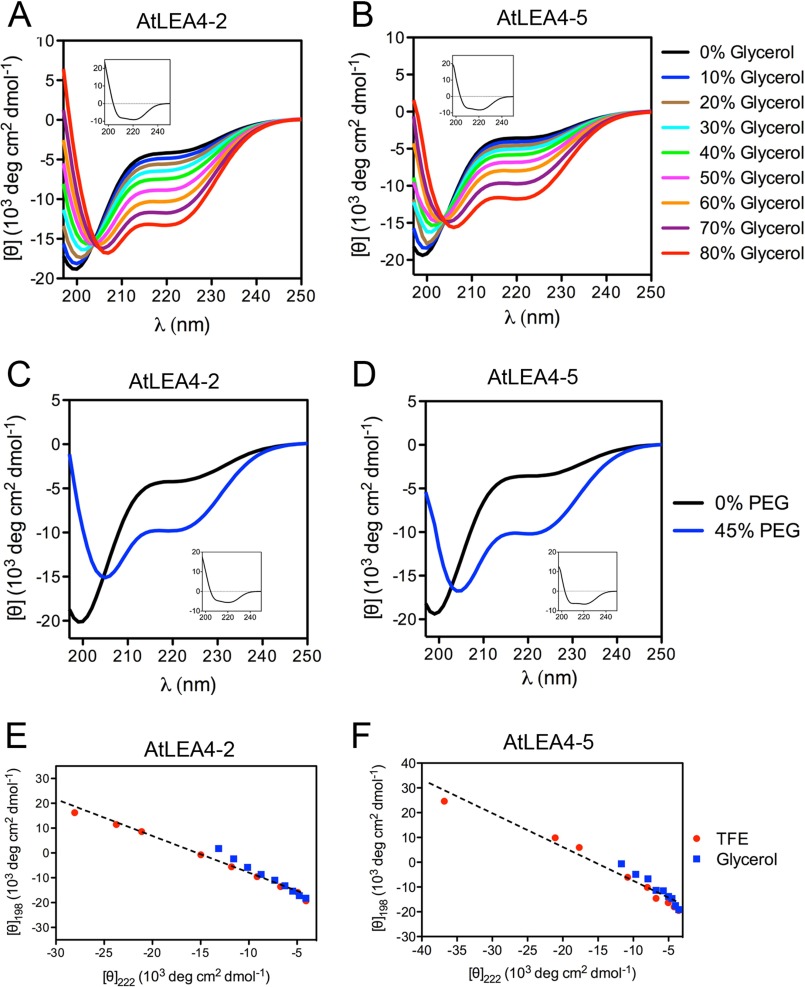
FIGURE 3.
Far UV CD spectra of AtLEA4-2 and AtLEA4-5 in different concentrations of glycerol or PEG. A and B, far UV CD spectra of AtLEA4-2 (A) and AtLEA4-5 (B) in glycerol/water mixtures at 0% (black), 10% (blue), 20% (brown), 30% (cyan), 40% (green), 50% (magenta), 60% (orange), 70% (purple), and 80% (red) glycerol. Difference spectra (Δ80–0% glycerol) are shown as insets in A and B. C and D, AtLEA4-2 (C) and AtLEA4-5 (D) in aqueous solution (black line) and in PEG/water mixture at 45% PEG 5000 (blue line). Difference spectra (Δ45–0% PEG) are shown as insets in C and D. E and F, transition diagrams for AtLEA4-2 (E) and AtLEA4-5 (F) were obtained using the ellipticity values at 198 and 222 nm from TFE and glycerol titrations. Dashed lines represent the linear fits of the data. These results were reproduced at least four times in autonomous experiments, using three independent purification batches of both proteins.

