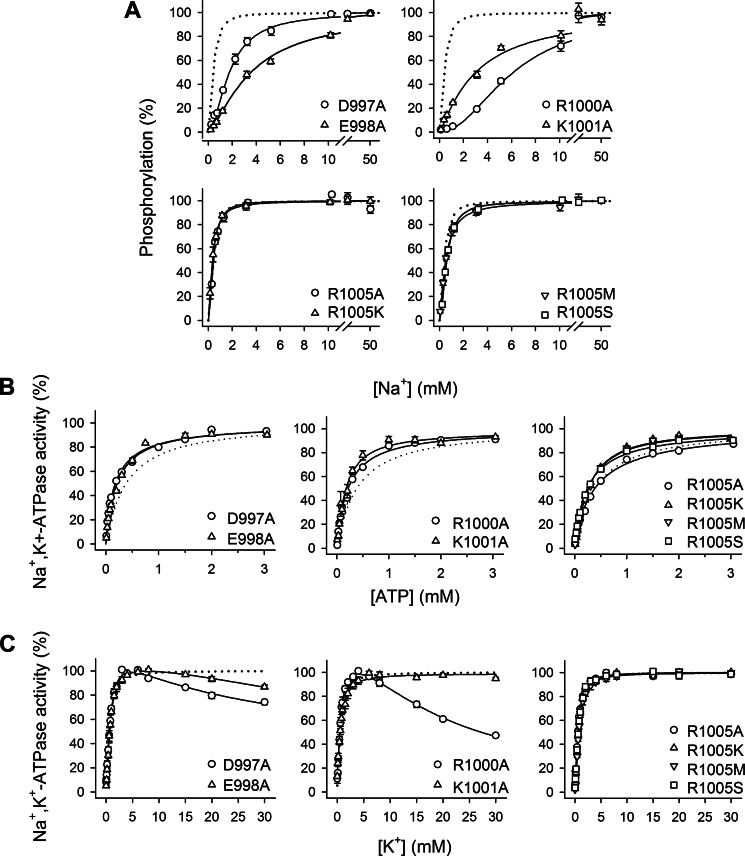
FIGURE 3.
Several charged residues in M10 near Ser-938, but not Arg-1005, are crucial to binding of Na+ at the intracellularly facing E1 sites. A, Na+ dependence of phosphorylation from [γ-32P]ATP. Each line shows the best fit of the Hill equation, and the extracted K0.5 values are listed in Table 1. B, ATP dependence of Na+,K+-ATPase activity. Each line shows the best fit of the Hill equation, and the extracted K0.5 values are listed in Table 1. C, K+ dependence of Na+,K+-ATPase activity. Each line shows the best fit of the Hill equation or, for the mutants showing inhibition at high K+ concentrations, a two-component Hill equation with the inhibition represented by a negative term. K0.5 values for the rising parts of the curves are listed in Table 1. A–C, experimental conditions and equations used for data fitting are described under “Experimental Procedures.” Statistical information is given in Table 1. Symbol and error bars (seen only when larger than the size of the symbols) represent mean ± S.E. Dotted lines reproduce the wild type for direct comparison in the same panel.

