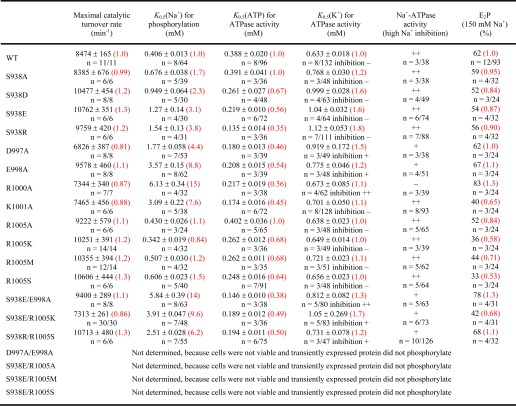
TABLE 1.
Functional analysis of mutants
-Fold changes relative to WT are shown in red parentheses. The number of independent experiments n/total number of data points and mean ± S.E. are indicated. ++, pronounced inhibition: +, partial inhibition; and −, no inhibition of ATPase activity by high K+ or Na+ concentrations.

