Figure 2.
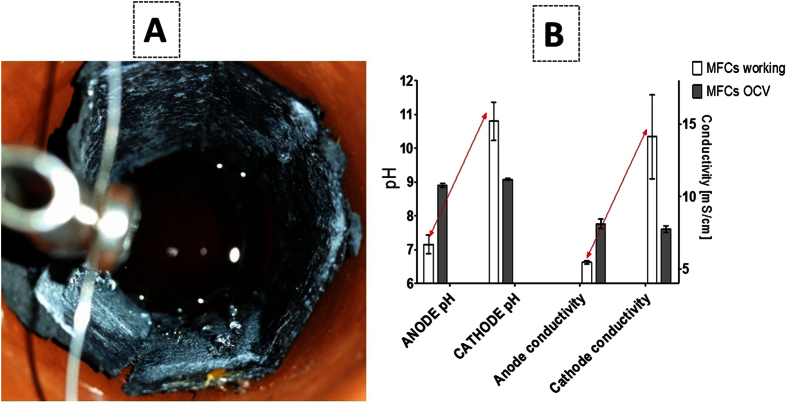
Photograph showing droplets formed inside the MFC cylinder accumulating liquid catholyte (A). Bar chart showing pH and conductivity measurements of the anolyte and catholyte, when the MFCs were producing power vs. the control MFC in open circuit conditions (B) data shown are the average (with error bars) from the three working MFCs, T1, T2 and T3 and three control MFCs T4, T5 and T6.

