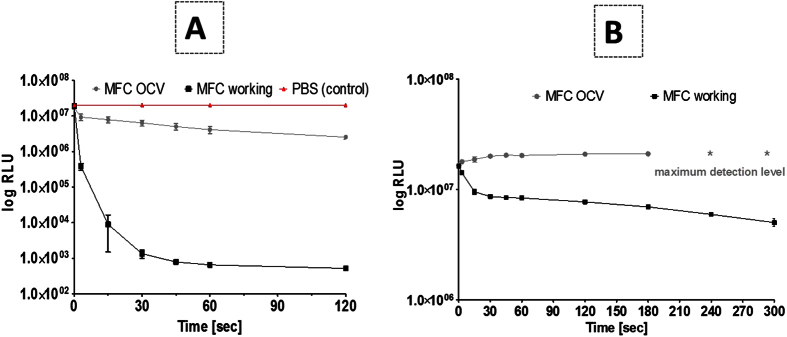
Figure 7.
Reduction in bioluminescence from E. coli exposed to neat catholyte obtained from closed circuit and open circuit conditions in comparison with the control (PBS) (A). Reduction in bioluminescence from E. coli exposed to 50% catholyte at pH 7.0 obtained from closed circuit and open circuit conditions (B) (*shows sample overload when the measurement exceeded the measuring range of the luminometer).

