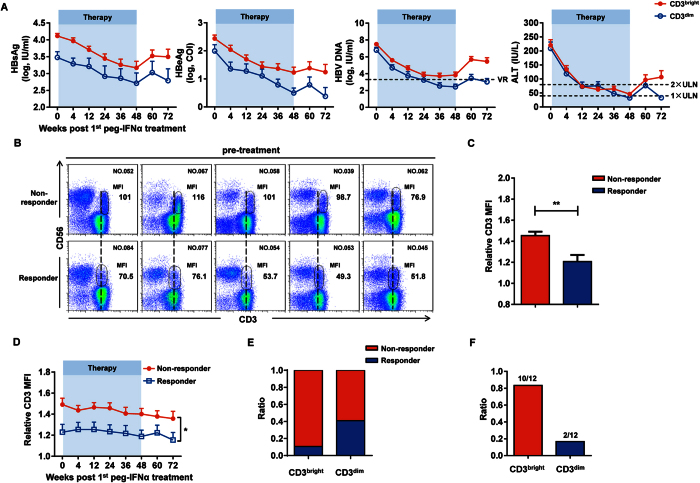
Figure 3. CHB patients harboring CD3brightCD56+ T cells exhibit a poor therapeutic response to peg-IFNα.
(A) HBsAg, HBeAg, HBV DNA, and ALT levels in CHB patients harboring CD3brightCD56+ (red) or CD3dimCD56+ (blue) T cells at the indicated time points since peg-IFNα treatment. VR, virological response; ULN, upper limit of normal. (B) Immunofluorescent staining of CD56+ T cells in CHB patients before peg-IFNα treatment grouped by treatment effect. CD3 MFI of CD56+ T cells in nonresponders and responders is indicated. (C) Relative CD3 MFI values on CD56+ T cells from nonresponders (red) and responders (blue) CHB patients. (D) Relative CD3 MFI was evaluated in the different treatment effect groups at the indicated time points since peg-IFNα treatment. (E) The ratio of nonresponders (red) and responders (blue) harboring CD3brightCD56+ (red) or CD3dimCD56+ (blue) T cells. (F) The ratio of CD3brightCD56+ (red) to CD3dimCD56+ (blue) T cell populations in CHB patients who harbored HBsAg values >20000 IU/mL at 12 or 24 weeks of treatment. Error bars, s.e.m. *P < 0.05, **P < 0.01, ***P < 0.001.

