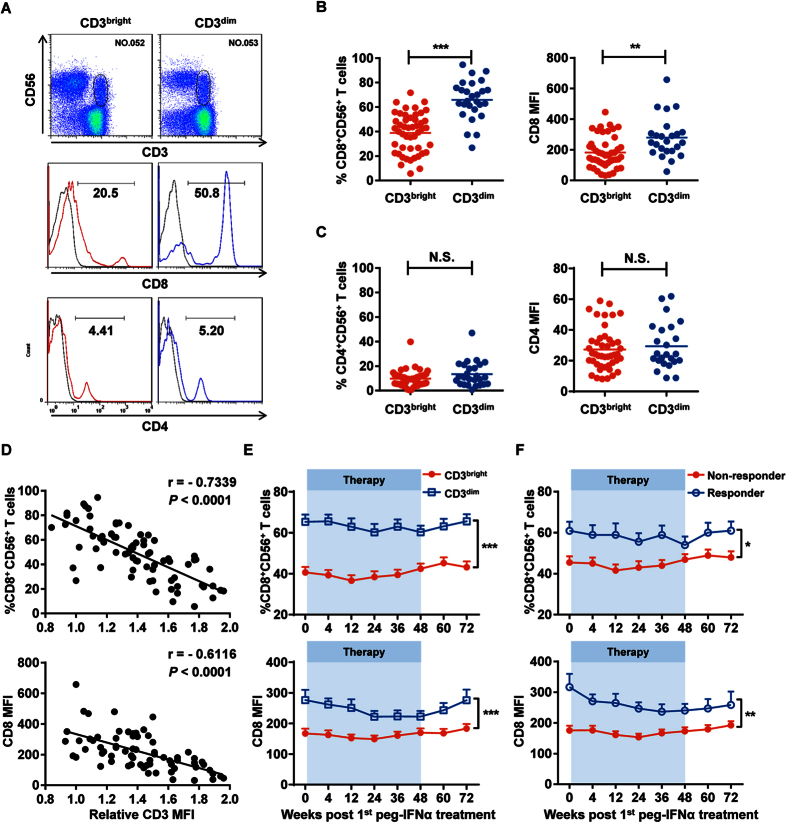
Figure 4. CD3brightCD56+ T cells expressed low CD8 levels.
(A) CD8 (middle panel) and CD4 (bottom panel) expression on CD3brightCD56+ (red) and CD3dimCD56+ (blue) T cells from their respective CHB patient groups. Isotype controls (grey) were shown, respectively. Fluorescent antibodies against anti-CD3 and anti-CD56 were used to identify CD56+ T cells in CHB patient PBMCs (upper panel). (B) Cumulative data for frequency (left) and MFI (right) for the CD8 data shown in the middle panel of (A). (C) Cumulative data for frequency (left) and MFI (right) for the CD4 data shown in the lower panel of (A). (D) Inverse correlation between the frequency/MFI of CD8 expression and relative CD3 MFI on CD56+ T cells in CHB patients. Pearson’s correlation coefficient: r = −0.7339; P < 0.0001. (E) The frequency and MFI of CD8 expression on CD3brightCD56+ (red) and CD3dimCD56+ (blue) T cells in their respective CHB patient groups since peg-IFNα treatment. (F) The frequency and MFI of CD8 expression on CD56+ T cells from nonresponders (red) and responders (blue) since peg-IFNα treatment. Error bars, s.e.m. *P < 0.05, **P < 0.01, ***P < 0.001. N.S., not significant.

