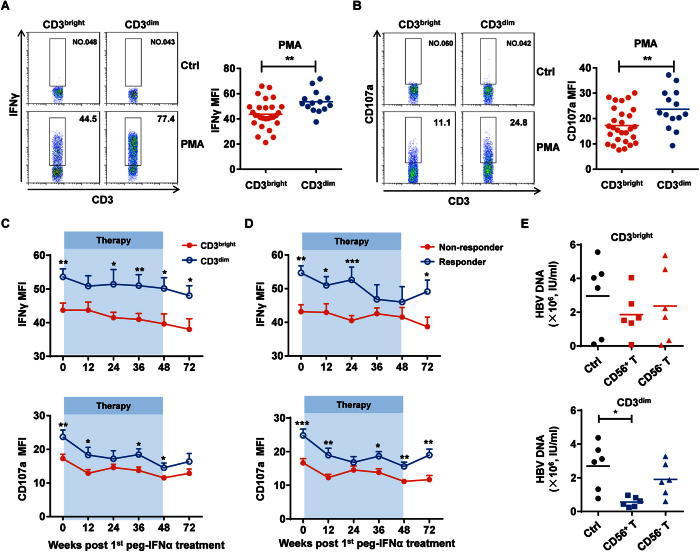
Figure 6. CD3brightCD56+ T cells exhibit dysfunctional antiviral responses.
(A) Freshly isolated PBMCs from CHB patients before treatment were stimulated with or without PMA and ionomycin for 4 h, and intracellular staining of IFNγ was determined using flow cytometry by gating on CD3+CD56+ cells. Statistical data are shown for the compiled data. (B) CD107a expression was detected since PMA and ionomycin stimulation. Statistical data are shown. (C) IFNγ (upper) and CD107a (lower) expression in CD56+ T from CHB patients harboring either the CD3brightCD56+ (red) or CD3dimCD56+ (blue) T cells at the indicated time points since peg-IFNα treatment. (D) IFNγ (upper) and CD107a (lower) expression on CD56+ T cells from nonresponders (red) and responders (blue) since peg-IFNα treatment. (E) Co-culture of HBV-carrying-HepG2.2.15 cells with purified CD3brightCD56+ (upper) or CD3dimCD56+ (lower) T cells at a 1:10 ratio via transwell system. HBV DNA were determined. Error bars, s.e.m. *P < 0.05, **P < 0.01, ***P < 0.001.

