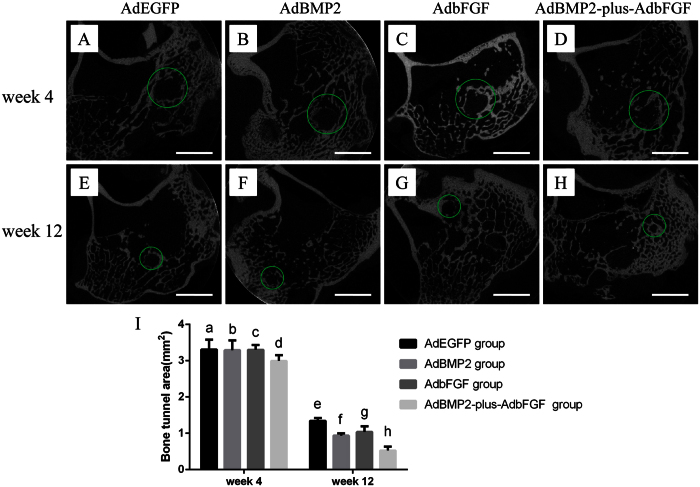
Figure 5. Micro-CT image of each group at 4 and 12 weeks postoperatively.
Green circles mark the bone tunnel. The areas of the bone tunnel were scanned among the AdEGFP, AdBMP2, AdbFGF, and AdBMP2-plus-AdbFGF groups at both 4 weeks (A–D) and 12 weeks (E–H). Quantitative analysis of the bone tunnel areas was performed at both 4 and 12 weeks (I). The bar represents the mean ± SEM, n = 6. At 4 weeks, there was no difference among the groups. At 12 weeks, f vs. e, P = 0.04; f vs. g, P = NS; g vs. e, P = 0.1; h vs. e, P < 0.01; h vs. f, P = 0.04; and h vs. g, P = 0.01.NS = no significance. Scale: 5 mm.

