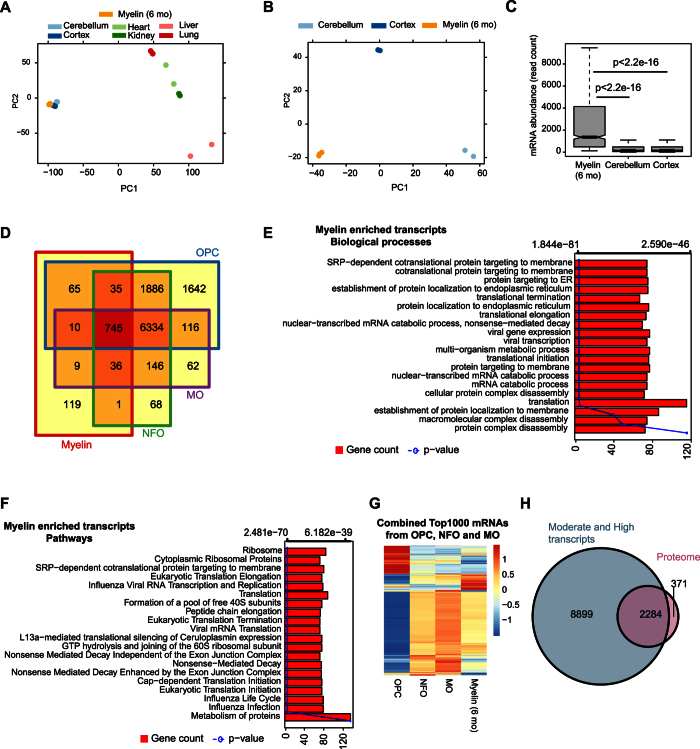
Figure 3. The transcriptome of mature CNS myelin.
(A) Principal component analysis (PCA) comparing the transcriptome of myelin with that of total cerebellum, cortex, heart, kidney, liver, and lung. First two principal components (PC) are represented as distances on x- and y-axis to display variation between samples. Myelin and brain samples cluster away from those of other germ layers. (B) PCA comparing the myelin transcriptome with cerebellum and cortex. Note the similarity of the three biological replicates of myelin. (C) Box-Whisker plots displaying the relative abundance of mRNAs that are at least 2-fold enriched in myelin compared to cerebellum and cortex (n = 1020). (D) Comparison of mRNAs that are at least 2-fold enriched in myelin compared to cerebellum and cortex with the mRNAs expressed in oligodendrocyte progenitor cells (OPC), newly formed oligodendrocytes (NFO), and myelinating oligodendrocytes (MO) according to Zhang et al. 2014. Only a subset of the mRNAs expressed in the oligodendrocyte lineage is enriched in myelin. (E) Bar plot showing biological processes associated with myelin-enriched transcripts. Bars indicate the number of genes in a category (x-axis); the line gives the p-value for each biological process. (F) Bar plot showing biological pathways associated with myelin-enriched transcripts. Bars indicate the number of genes in a category (x-axis); the line gives the p-value for each pathway. (G) Heat map of the top 1000 most abundant mRNAs expressed in the oligodendrocyte lineage (combined OPC, NFO, and MO) to compare their abundance with that in myelin. mRNAs expressed in the oligodendrocyte lineage are not necessarily enriched in myelin, and myelin-enriched mRNAs are not necessarily among the most abundantly expressed oligodendroglial mRNAs. (H) Venn diagram comparing the mass spectrometrically identified proteins in purified myelin with the mRNAs detected in myelin at a high or moderate level at the same age (6 months).

