Fig. 1.

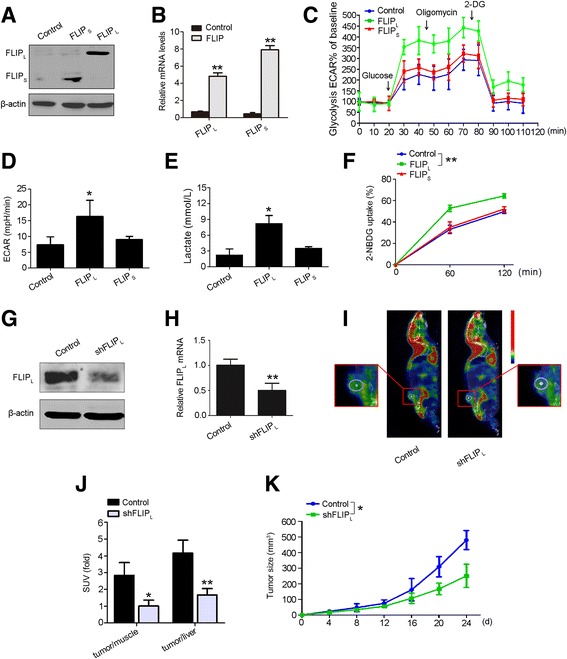
FLIPL promotes aerobic glycolysis by up-regulating glucose uptake. a and b HepG2 cells were transfected with FLIPL or FLIPs overexpression vectors. Expression was detected 48 h after transfection in protein and mRNA levels. Data are the mean ± S.E.M. from three independent experiments. **p < 0.01 versus the control group. Cell ECAR in c and d was measured by the glycolysis stress test in HepG2 cells with FLIPL or FLIPS overexpression. Data represent the mean ± S.E.M. from three independent experiments, each performed in quadruplicate. *p < 0.05 versus the control group. e Lactate production was measured in HepG2 cells with FLIPL or FLIPS overexpression. Data represent the mean ± S.E.M. from three independent experiments, each performed in quadruplicate. *p < 0.05 versus the control group. f Glucose uptake was measured in HepG2 cells with FLIPL or FLIPS overexpression. Cells were grown in the presence of the fluorescent analog 2-NBDG for various time points, and glucose uptake was quantified using FACS analysis. Data represent the mean ± S.E.M. Similar results were obtained from three independent experiments. **p < 0.01 versus the control group. g and h HepG2 cells were transfected with shFLIPL vector. Expression was detected 48 h after transfection in protein and mRNA levels. Data are the mean ± S.E.M. from three independent experiments. **p < 0.01 versus the control group. i Representative PET/CT images in nude mice bearing liver tumors with control or shFLIPL plasmid treatment. Yellow dotted lines indicate area of the liver tumors. j Glucose uptake in HCC was normalized with muscle or liver tissues in each mouse (n=8). Data are presented as the mean ± S.D. *p < 0.05, **p < 0.01 versus control. k Tumor development in nude mice bearing with FLIPL-silent HepG2 cells (n=8). Data are presented as the mean ± S.D. *p < 0.05 versus control
