
Fig. 2.
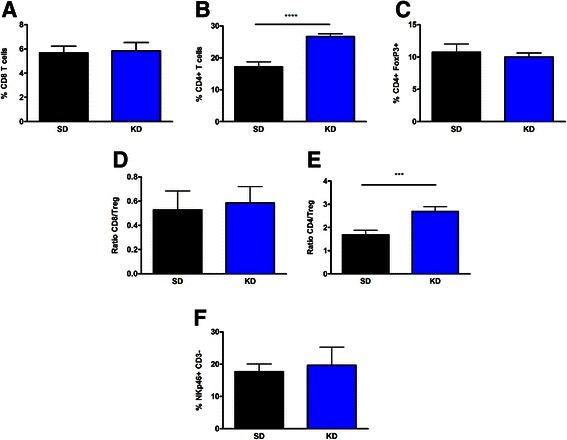
CD4+ T cell infiltration increases in mice fed the KD, without increases in Treg cell numbers. Flow cytometry analysis was performed to assess the cell types infiltrating tumors from mice fed both SD and KD. CD8 T cells (a), CD4 T cells (b) and CD4 + FoxP3+ T regulatory cells (c) were assessed. The ratio of CD8 T cells to T regulatory cells (d) and CD4 to T regulatory cells (e) were determined. The percent of infiltrating NKp46 + CD3- natural killer cells (f) were also assessed. N = 5; student’s two-tailed t-test; ***p < 0.001; ****p < 0.0001