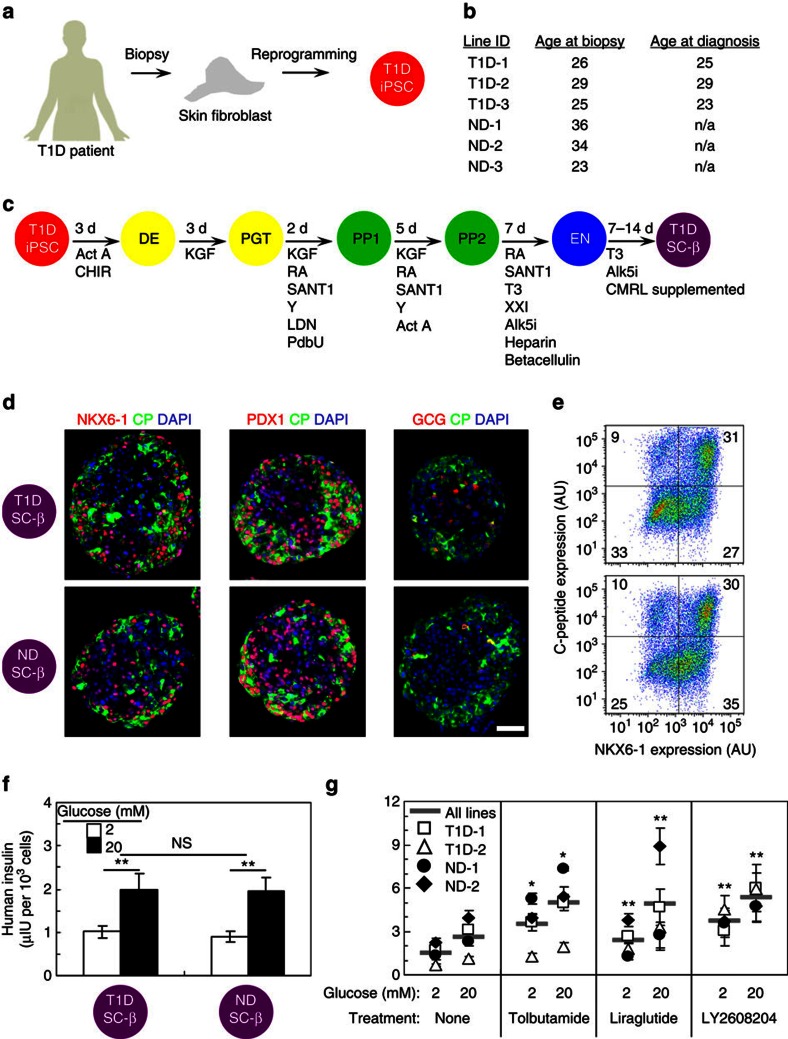
Figure 1. T1D SC-β cells express β-cell markers and secrete insulin in response to high glucose and anti-diabetic drug treatment in vitro.
(a) Schematic summarizing derivation of hiPSC from T1D patients. (b) Table of cell lines used in study, showing donor age at the time of skin biopsy procurement and age of diagnosis of T1D, if applicable. (c) Schematic summarizing differentiation protocol used to produce SC-β cells. (d) Representative immunostaining of T1D and ND SC-β cells stained for NKX6-1, PDX1, glucagon (GCG; red) with C-peptide (CP; green) and 4,6-diamidino-2-phenylindole (DAPI) (blue). Scale bar, 100 μm. (e) Representative flow cytometry plot of dispersed clusters stained for C-peptide and NKX6-1. AU, arbitrary units. (f) Average ELISA measurements of secreted human insulin at 2 and 20 mM glucose. n=9 and 9 SC-β cell batches, each consisting of 3 T1D donors and 3 ND donor. **P<0.01 comparing 20 and 2 mM glucose treatments (two-sided paired t-test). (g) ELISA measurements of secreted human insulin at 2 and 20 mM glucose for a subset of cell lines treated with the anti-diabetic drugs Tolbutamide (sulfonylurea), Liraglutide (GLP-1 R agonist) and LY2608204 (GCK activator). n=4 measurements for each line. *P<0.05 and **P<0.01 comparing drug treatment with no treatment at the same glucose concentration (two-sided unpaired t-test). Data shown as mean±s.e.m. Samples taken after 10–17 days in Stage 6. Act A, activin A; Alk5i, Alk5 receptor inhibitor II; CHIR, CHIR9901; KGF, keratinocyte growth factor; LDN, LDN193189; PdbU, phorbol 12,13-dibutyrate; RA, retinoic acid; T3, triiodothyronine; Y, Y27632.

