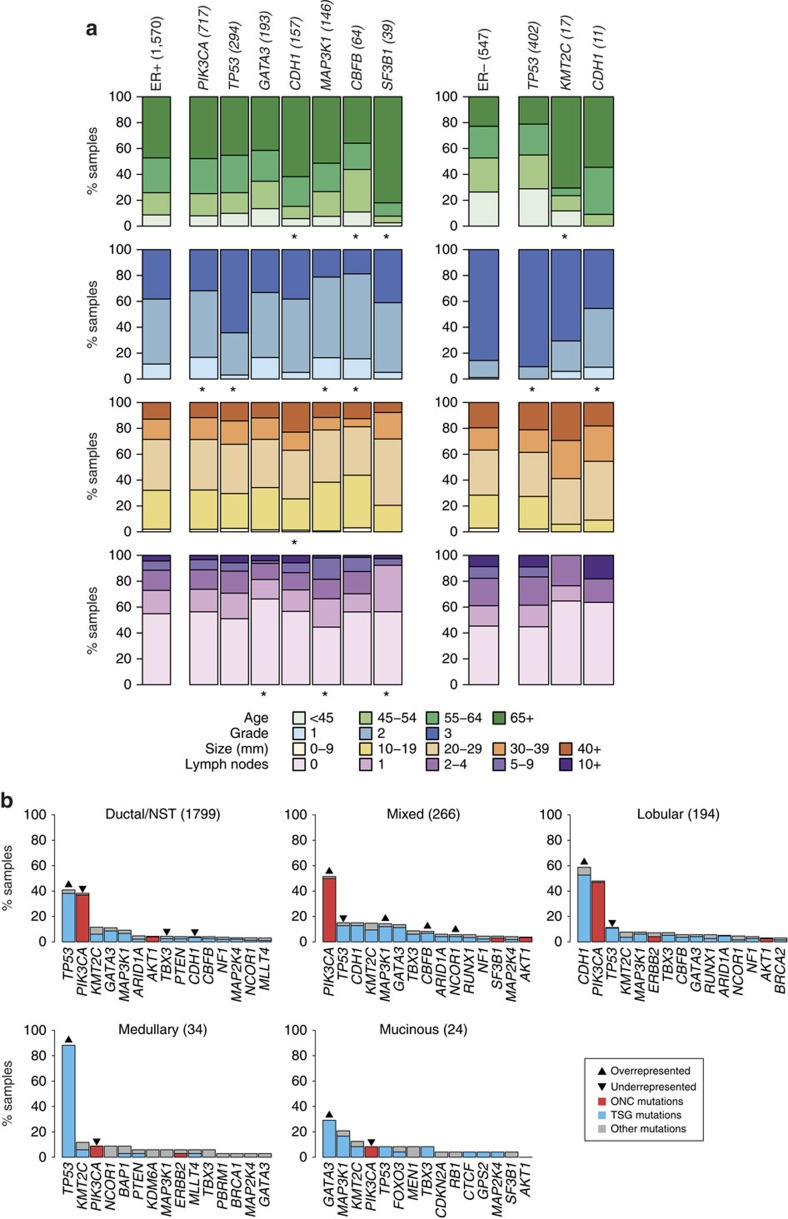
Figure 2. Associations between mutations and clinical-pathological variables.
(a) The associations between functional mutations in Mut-driver genes and patient age, tumour grade, size and number of lymph nodes involved are depicted for ER+ (left) and ER− (right) samples. Bars depict the categorical distributions of each variable in samples harbouring a functional mutation in the specified gene. The single bars on the left of each panel show the distributions of the variables for either all ER+ or ER− samples. The numbers of samples with mutations in the genes are shown in brackets. For each gene, we looked for a difference in the distributions of a variable between wild-type and mutant samples. All genes for which at least one association was found (χ2-test; FDR=0.05) are shown, and ‘' indicates the significant associations. The analysis was performed for genes mutated in at least 1% of ER+ or ER− samples. (b) Bars depict prevalence of mutations in Mut-driver genes across histological subtypes. The 15 most frequently mutated genes in each subtype are shown. The coloured part of each bar indicates functional mutations, which were defined as recurrent mutations that contribute to an oncogene's ONC score (red), or inactivating mutations that contribute to a tumour suppressor gene's TSG score (see main text). Both recurrent and inactivating mutations were considered for TP53. Up arrows and down arrows indicate over/under-representation of mutations, respectively, in the specified gene relative to all other samples (Fisher's exact test; FDR=0.05). NST, no special type.

