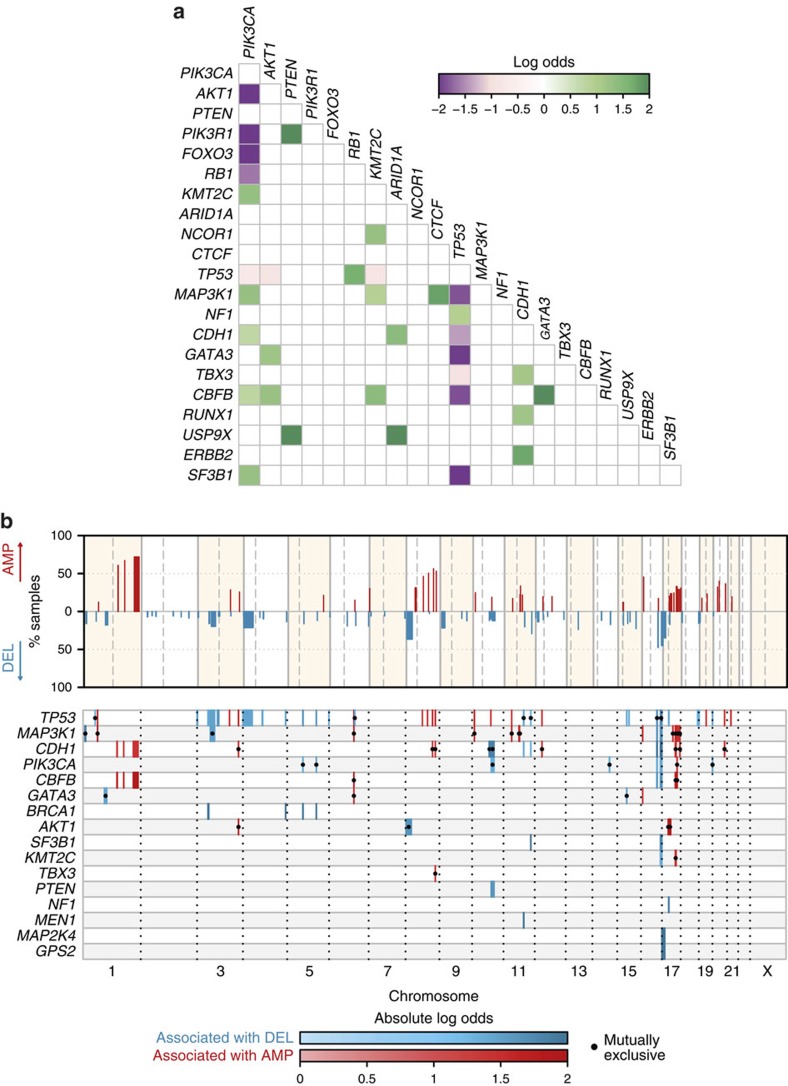
Figure 3. Patterns of association between somatic events.
(a) Pairwise association plot for 40 Mut-driver genes in 2,433 samples. Purple squares represent negative associations (mutually exclusive mutations); green squares represent positively associated events (co-mutation). The colour scale represents the magnitude of the association (log odds). We considered all genes mutated in at least 0.5% of the entire cohort, and only associations at FDR=0.1 are shown (Fisher's exact test). (b) Association plot of CNAs and Mut-driver gene mutations. Top panel: significantly recurrent copy number aberrations (CNAs) identified by GISTIC2 are shown across the genome, along with the percentage of samples affected by the particular CNA. Bottom panel: plot showing Mut-driver gene mutations associated with CNAs. Associations (Ass.) with amplifications and deletions are coloured red and blue respectively, and the colour scale corresponds to the magnitude of the association (log odds). Associations with dots represent mutual exclusivity and those without dots represent co-occurrence. Only genes with at least one significant association (Fisher's exact test; FDR=0.01) are shown, and only associations with absolute log odds ⩾log(2) were considered.

