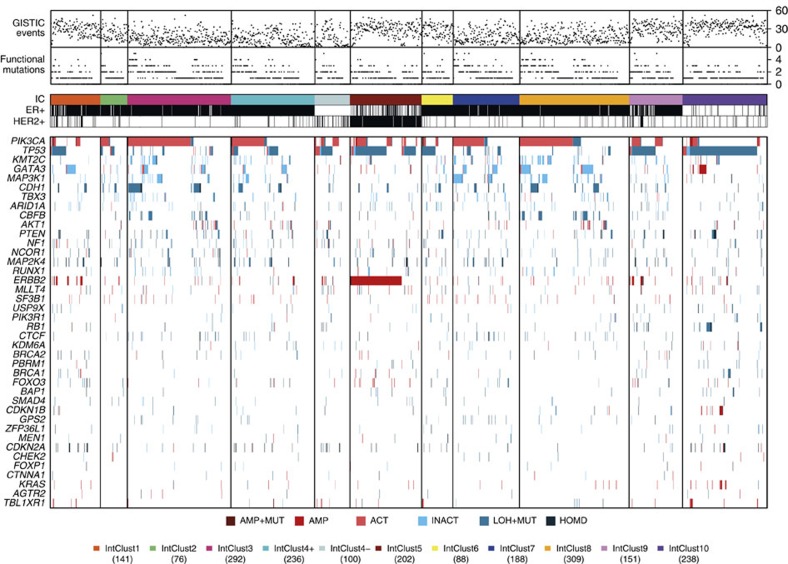
Figure 4. Genomic profiles of the Integrative Clusters.
Tumours with both mutation and copy number data available (n=2,021) are grouped by IntClust along the x-axis, and alterations in the 40 Mut-driver genes are indicated by coloured bars. For each tumour, the number of functional mutations in Mut-driver genes and the number of recurrent CNAs (as defined by GISTIC2) events are also shown. AMP, amplification; ACT, activating mutation; HOMD, homozygous deletion; INACT, inactivating mutation; LOH+MUT, mutation and hemizygous deletion.

