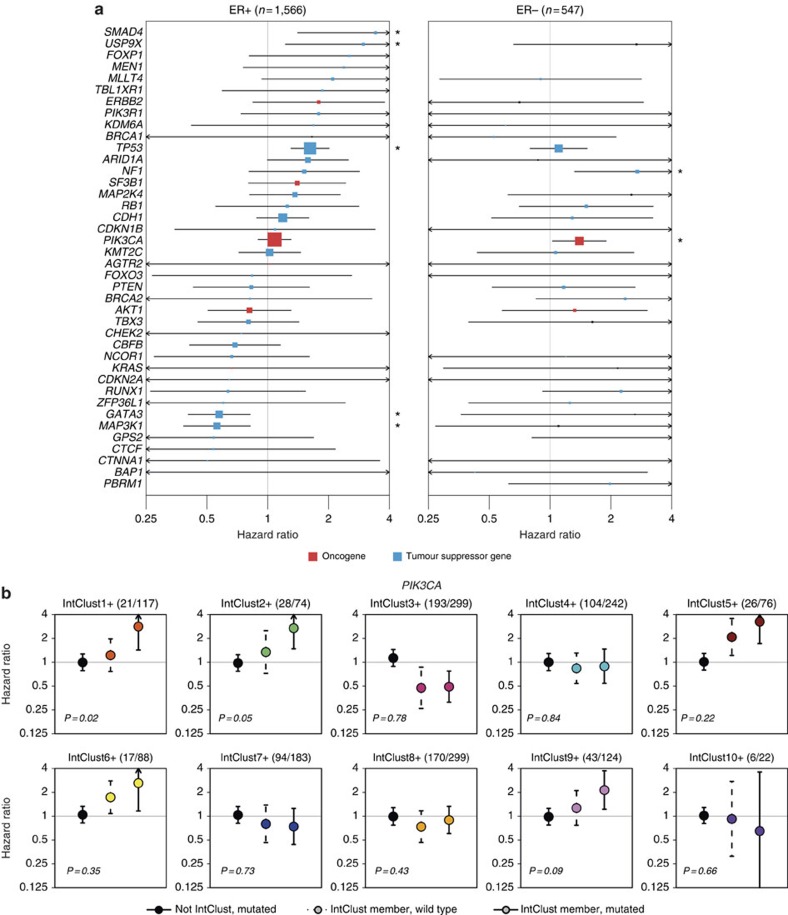
Figure 6. Associations between mutations in the 40 Mut-driver genes and survival.
(a) Multivariable Cox proportional hazards models were constructed to assess the associations between functional mutations in Mut-driver genes and breast cancer-specific survival (BCSS) in ER+ (left) and ER− (right) cancers. For oncogenes (red), we considered only recurrent mutations, whereas only inactivating mutations were used for tumour suppressor genes (blue). Both classes of mutations were used for TP53. The lines represent 95% confidence intervals and sizes of the boxes correspond to the inverse of the interval size. Arrows indicate confidence intervals extending beyond plot range, and ‘' mark genes where mutations are associated BCSS at P<0.05. Some genes did not have sufficient mutations in the ER− cohort to obtain a hazard ratio estimate. (b) The association between functional PIK3CA mutations and BCSS were analyzed in ER+ tumours after stratifying by IntClust. For each IntClust, univariable Cox models were constructed to obtain a hazard ratio estimate for PIK3CA mutations in tumours not belonging to the particular IntClust (left; black point, solid line), the effect of IntClust membership for tumours with wild-type PIK3CA (middle; coloured point, dashed line), and the simultaneous effects of PIK3CA mutation and IntClust membership (right; coloured point, solid line). Lines and arrows represent confidence intervals as in Fig. 6a. The P values represent the significance of the interaction between PIK3CA mutation and IntClust membership in the Cox model. The fraction of tumours harbouring PIK3CA mutations within each IntClust is also indicated in brackets.

