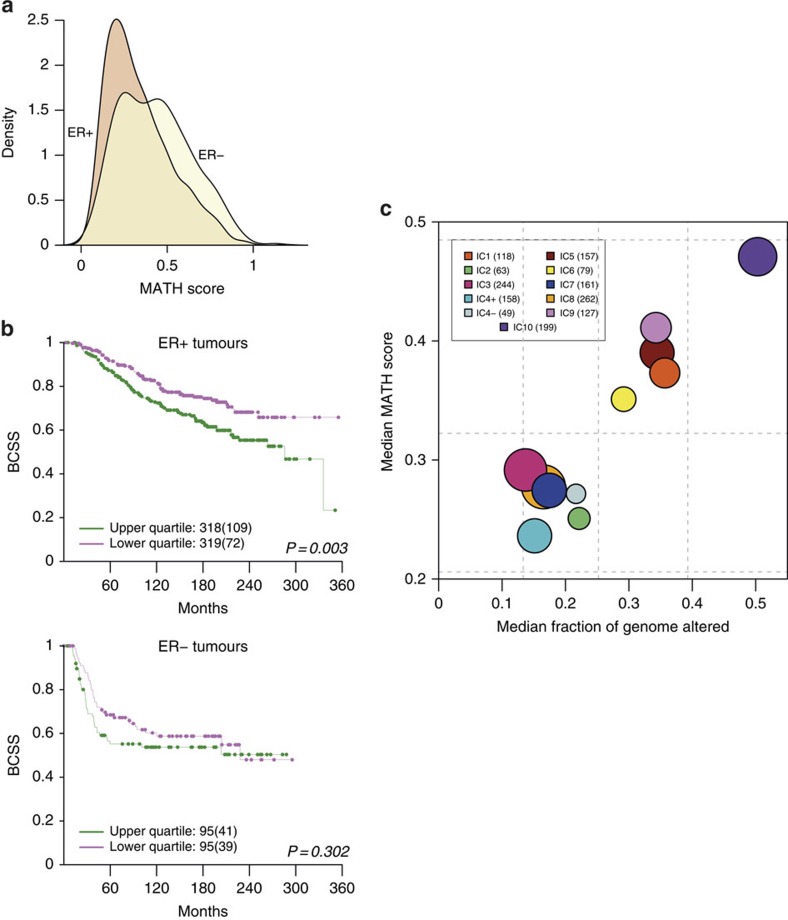
Figure 7. Intra-tumour heterogeneity in breast cancers stratified by IntClust.
(a) The distributions of mutant-allele tumour heterogeneity (MATH) scores are shown for ER+ and ER− tumours. The score represents a measure of the level of intra-tumour heterogeneity, and was calculated for each tumour as described in Methods. In general, ER+ samples have lower MATH scores than ER− samples, although there are a number of ER+ samples with higher scores. Tumours with fewer than five mutations were excluded from this analysis. (b) Kaplan–Meier survival curves (BCSS) are shown for tumours whose MATH scores fall in the lower or upper quartiles of the ER+ (top) and ER− (bottom) distributions. The numbers of samples under consideration are indicated, and the numbers in brackets represent the deaths occurring in each cohort. (c) Bubble plot of median MATH scores and CIN scores for each IntClust. The CIN is a measure of the percentage of the genome altered by CNAs. Dashed lines depict the quartiles for both scores (vertical lines, CIN quartiles; horizontal lines, MATH score quartiles) in the cohort as a whole. The areas of the circles are proportional to number of samples in each IntClust.

