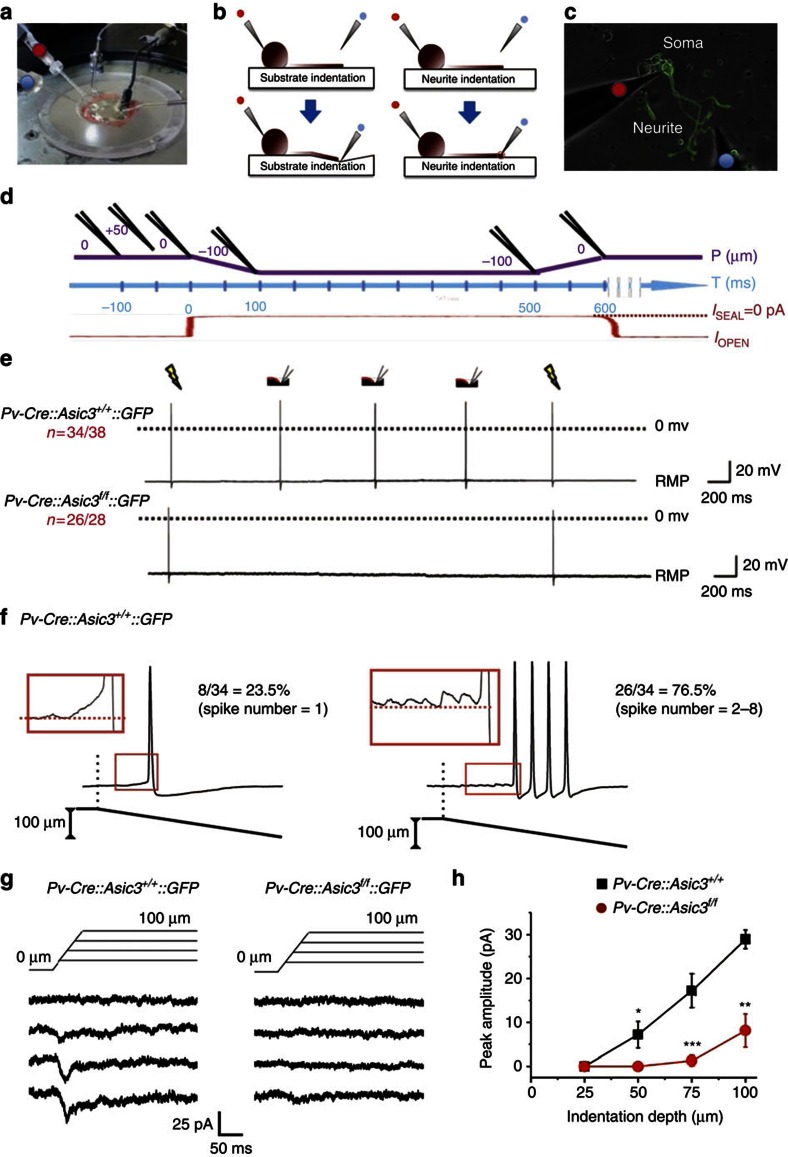
Figure 4. ASIC3 mediates substrate deformation-driven neurite stretch (SDNS)-induced firing in Pv+ DRG neurons.
(a) Experimental setup for whole-cell patch-clamp recording. The red dot indicates the recording pipette and the blue dot indicates the indentation pipette. (b) Schematic of stretching (left panels: substrate indentation, SDNS) or pressing on (right panels: neurite indentation, DNI) a neurite grown on an elastic substrate. (c) Cultured on a PDMS substrate, the soma of a suitable GFP-positive Pv+ DRG neuron was patched with a recording pipette (red dot). An indentation pipette (blue dot) was positioned 300 μm away from the patched soma and on top of (DNI) or 15–25 μm away from (SDNS) the neurite. (d) Experimental protocol for mechanical stretching. The temporospatial relationship of the indentation pipette (in black above the purple line), the surface of the PDMS substrate (purple line) are illustrated and aligned with the recording time (blue line). The leak current of the indentation pipette (red line) monitors when the pipette contacts the PDMS surface. The leak current when sealed (Isealed) is taken as 0 pA (see the Methods for details). (e) Each SDNS generated an action potential in wild type, but not Asic3-null Pv+ DRG neurons. RMP, resting membrane potential. Electrical stimulation via the patch electrode (yellow flashes) also generates a similar action potential response. (f) In 34/38 wild-type Pv+ DRG neurons, SDNS induced single (n=8) or a train of (n=26) action potentials. (g) SDNS-induced mechanosensitive currents were recorded via voltage clamp. In wild-type Pv+ DRG neurons, indentation depths of 25, 50, 75 and 100 μm generated progressively increasing inward currents. The current was dramatically decreased in Asic3-knockout Pv+ DRG neurons. (h) Comparison of the SDNS-induced mechanical currents in wild-type and Asic3 KO Pv+ DRG neurons. Significant differences with genotype was (Mann–Whitney U-test) are found at indentation depths of 50, 75 and 100 μm (U=30.0, P<0.05; U=10.0, P<0.01; U=14.5, P<0.01, respectively). Data are mean±s.e.m. *P<0.05, **P<0.01, ***P<0.001 between groups.

