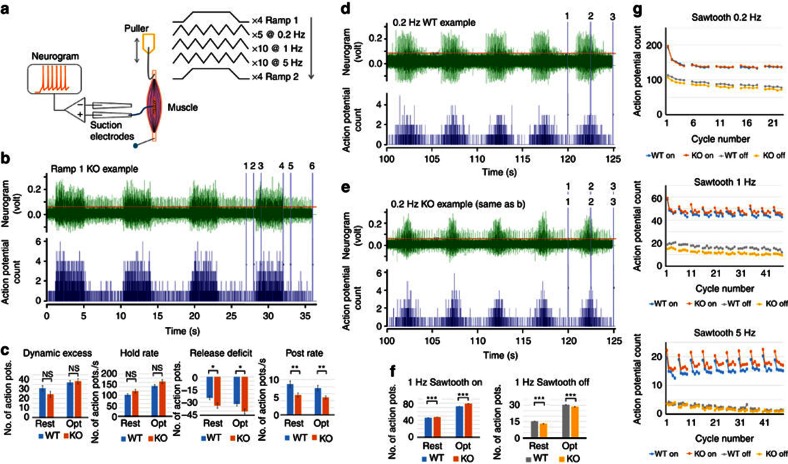
Figure 6. Asic3 KO enhances muscle proprioceptor dynamic sensitivity.
(a) Recording arrangement and stretch protocol. The ex vivo mouse soleus muscle was pinned to the PDMS at one end and stretched by an electromagnetic puller at the other end. The nerve was drawn into a suction electrode record stretch-evoked activity. A series of stretches was applied at two initial lengths— ‘resting', then ‘optimal' (see the Methods for details). (b) Typical responses to ramp stretches in a conditional knockout (KO, Pv-Cre::Asic3f/f) mouse (green trace). Action potentials exceeding the cursor position just above background noise are counted (blue trace below, bin width 0.01 s). The numbered vertical cursors show the phases of the ramp where action potential total counts were determined: 1–2, pre-stretch; 2–3, ramp-on; 3–4, hold; 4–5, ramp-off; 5–6, post-stretch. (c) Comparisons at different phases of the ramp of the proprioceptor responses in WT (Asic3f/f) and KO (Pv-Cre::Asic3f/f) mice. Dynamic excess: action potential count during ramp-on exceeding that expected from linear interpolation between pre-stretch and hold rate. Release deficit: action potential count during ramp-off below the linear interpolation between hold and post-stretch rates. (d) Typical response to repeated triangular (‘sawtooth') stretch-and-release at 0.2 Hz in a WT mouse (green trace). Numbered vertical cursors mark the stretch (ON/on in f,g) and release (OFF/off in f,g) of a group of 5 triangles. (e) As in d, for the KO (Pv-Cre::Asic3f/f) mouse shown in b. (f) ON and OFF proprioceptor responses from WT (Asic3f/f) and KO (Pv-Cre::Asic3f/f) mice to 1 Hz sawtooth stretch. (g) Mean on and off phase action-potential counts for sawtooth stretches at 0.2, 1 and 5 Hz in WT and KO mouse soleus muscles from resting lengths, showing the consistent differences. The intervals between successive groups of 5 triangular stretches allowed some recovery in firing rate in an otherwise steady adaptation over time. In c and f: rest, muscles initially at resting length; opt, muscles initially at optimal length. Data are mean±s.e.m. Significance of differences: *P<0.05; **P<0.01; ***P<0.001.

