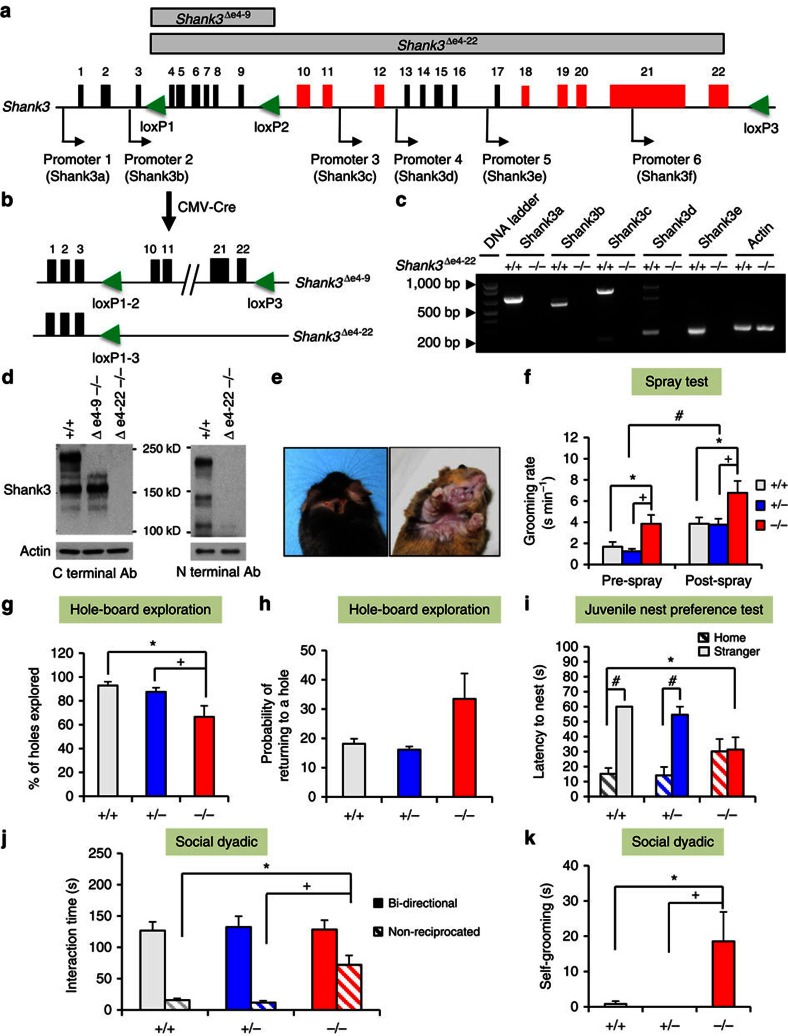
Figure 1. Generation of Shank3 complete knockout mice and their ASD-like behaviours.
(a) Schematic design for Shank3 complete knockout mice using a Cre-loxP strategy. Alternatively spliced exons are in red and promoters are indicated by arrows. loxP sites are green triangles. (b) e4–22floxed mice were crossed with CMV-Cre mice to generate deletion of Δe4–9 or Δe4–22, respectively. (c) All mRNA isoforms of Shank3 were deleted in Δe4–22−/− (−/−) mice relative to Δe4–22+/+ (+/+) mice, as shown by RT–PCR. (d) Western blot shows that all Shank3 protein bands are absent in −/− brain, using Shank3 C- and N-terminal antibodies. The experiments were repeated three times. (e) Skin lesions were observed in >50% of −/− mice, but not in +/+ or Δe4–22+/− (+/−) mice (χ2(2,N=89)=38.4, P<0.001). (f) −/− mice spent significantly more time in self-grooming (RMANOVA: genotype F(2,46)=5.68, P<0.01), relative to +/+ and +/− mice (ps<0.01), n=15–18/genotype. (g,h) Hole-board exploration. (g) On the hole-board, −/− mice explored fewer holes (ps<0.05) than the other genotypes (F(2,21)=5.64, P<0.02) (h) with the −/− mice showing a trend for increased probability of re-investigating holes (F(2,21)=2.99, P<0.08); n=7–8/genotype. (i) −/− pups (P15) failed to demonstrate a preference for their home over a stranger's nest, whereas +/+ and −/− littermates preferred and rapidly entered (ps<0.001) their home nest (RMANOVA: nest-choice × genotype F(2,25)=4.38, P<0.03); n=8–10/genotype. (j,k) Responses in the social dyadic test. (j) No genotype differences were detected in bidirectional contact in the social dyadic test. However, the duration of non-reciprocated interaction was prolonged (ps<0.001) in −/− mice (F(2,37)=11.30, P<0.001); n=10–15/genotype. (k) During the social dyadic test, −/− mice engaged in more self-grooming (F(2,37)=4.99, P<0.02) than the other genotypes (ps<0.02); n=10–15/genotype. For all panels, *P<0.05 from +/+; +P<0.05 from +/−; #P<0.05, within genotype for post hoc comparisons. All data are expressed as means±s.e.m. RT–PCR, PCR with reverse transcription.

