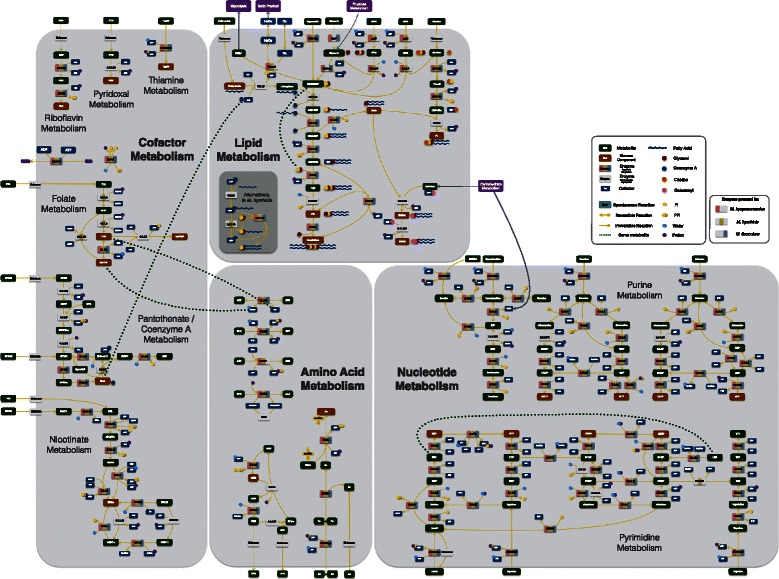
Fig. 4.

Lipid, amino acid, nucleotide and cofactor complete models. Metabolites are depicted in dark green and separate enzymatic activities for M. hyorhinis, M. hyopneumoniae and M. flocculare can be seen in yellow, pink and blue, respectively. Whenever an enzyme is missing from the three species, the enzyme rectangle is depicted in grey. Complete list of metabolite abbreviations and EC numbers can be found in Additional file 4
