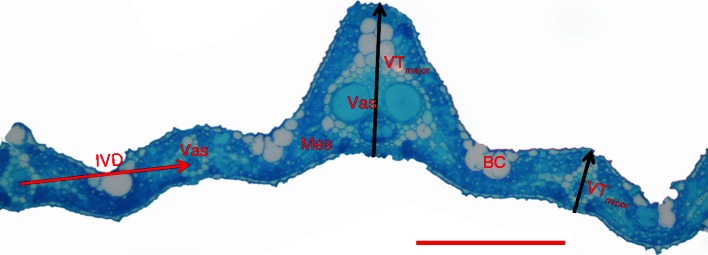
Fig. 1.
Diagram illustrating details of the leaf anatomical traits measured. Black arrows show major (VTmajor) and minor vein thicknesses (VTminor), and red arrow shows the intervein distance between two minor veins (IVD). BC, bulliform cells; Mes, mesophyll cells; Vas, vascular tissue. Scale bar = 100 μm.

