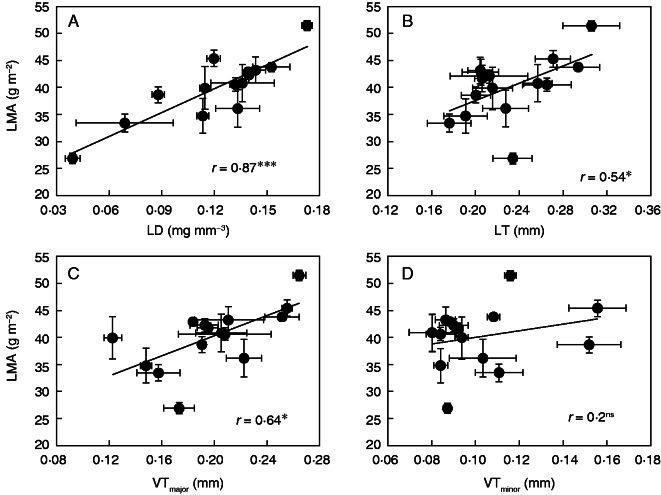
Fig. 2.
Relationships between leaf mass per area (LMA) and (A) leaf density (LD), (B) leaf thickness (LT), (C) major vein thickness (VTmajor) and (D) minor vein thickness (VTminor) in different rice varieties. Data points are means ± s.d. of three replicates. The lines are the linear regressions; * and *** indicate significance at P < 0·05 and P < 0·001, respectively, and ns indicates non-significance at P < 0·05.

