
Fig. 2.
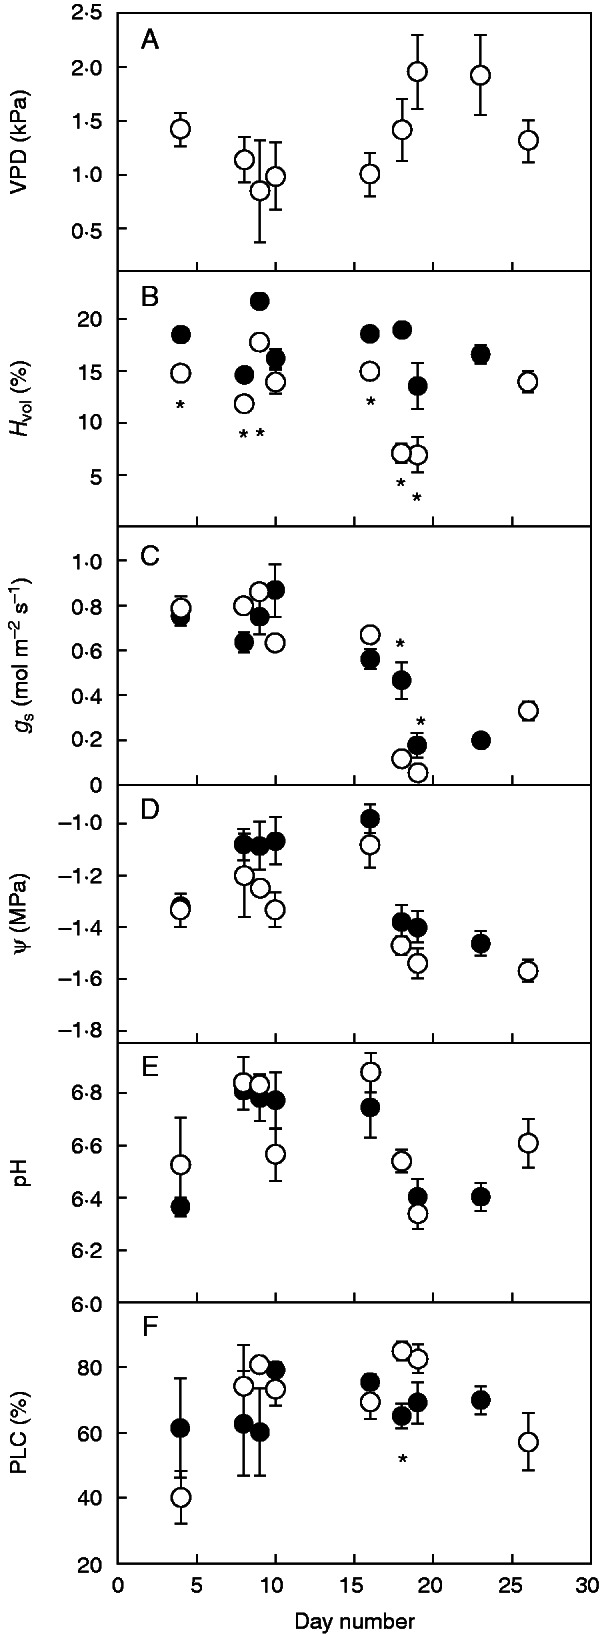
Daily mean±s.e. values of (A) average air vapour pressure deficit inside the greenhouse at the time of measuring, (B) mean volumetric soil water content for the plants measured each day, (C) light-saturated mid-morning stomatal conductance, (D) shoot water potential, (E) xylem sap pH and (F) percentage loss of stem hydraulic conductance. Data are means of 3–10 observations for two watering regimes, R1 (filled symbols) or R2 (empty symbols). An asterisk denotes significant differences between watering regimes.