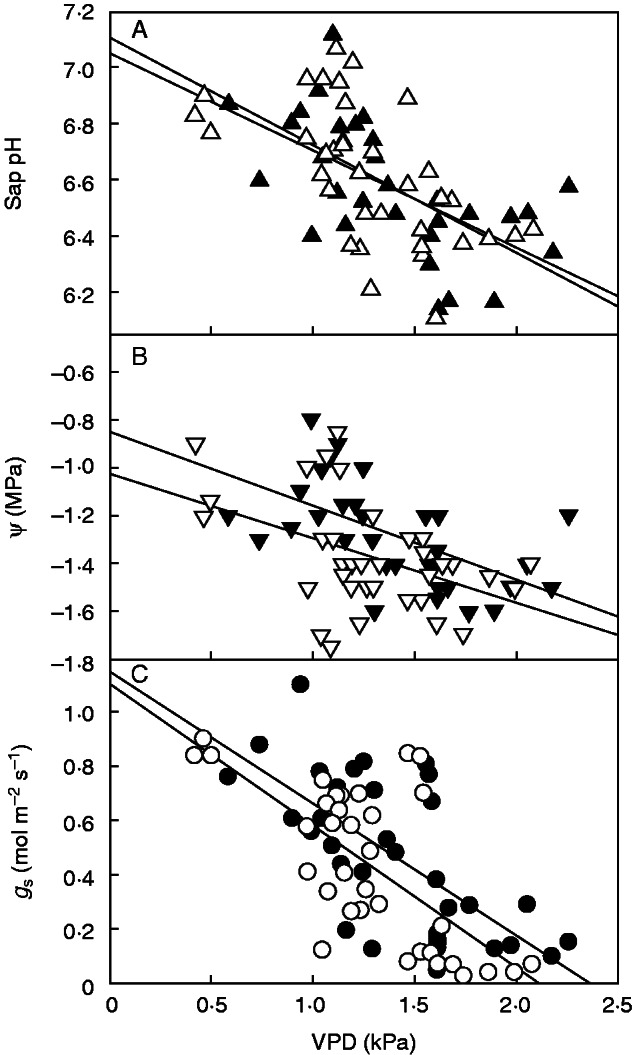
Fig. 3.

Relationships between air vapour pressure deficit inside the greenhouse at the time of measuring and (A) sap pH, (B) shoot water potential and (C) stomatal conductance. Every point within each graph corresponds to data measured on one single plant. Filled symbols correspond to plants under the more favourable watering regime (R1) and empty symbols to the less favourable R2 watering. Regression lines were fitted to both watering regimes.
