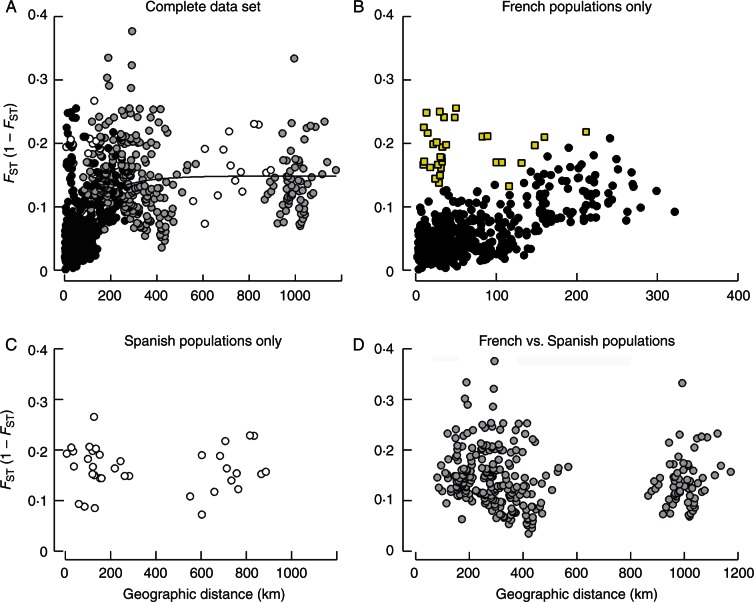
Fig. 3.
Scatterplots of pairwise FST/(1 – FST) against geographic distances (km). (A) Pairwise combinations of 41 populations sampled. (B) Pairwise combinations of 32 populations in France, yellow square symbols represent the pairwise combinations between Lauret, a yellow monomorphic population, and the other populations in France. (C) Pairwise combinations of nine populations in Spain and (D) pairwise combinations between populations in France and Spain. Statistical analyses have been performed with ln (geographical distance), but here we present non-transformed distances to illustrate the saturated shape.

