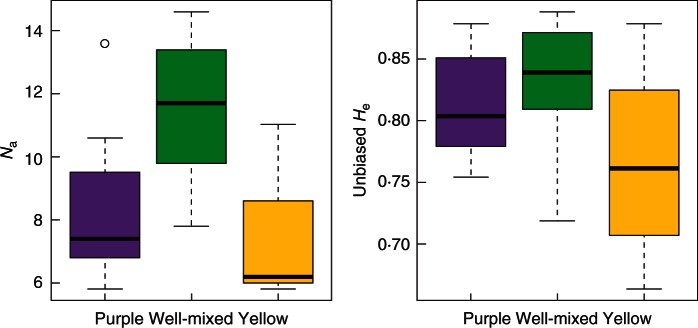
Fig. 5.
Boxplot for the estimates of genetic diversity according to the colour type of populations. Na, mean number of alleles per population; unbiased He, unbiased expected heterozygosity per population. Purple dominant: 0 ≤ FYM < 0·25; well-mixed: 0·25 ≤ FYM ≤ 0·75; yellow dominant: 0·75 < FYM ≤ 1. For both parameters, the relationship with FYM2 is significantly different from 0 (P < 0·0001, see text for details).

