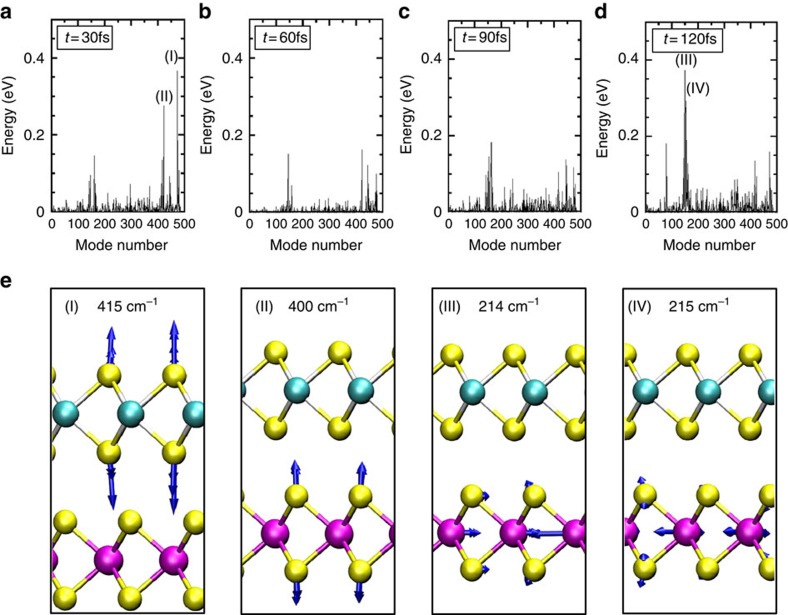
Figure 3. Energy of normal modes of the system as a function of time.
This depicts the increase in energy of every vibrational mode of the system as a function of time throughout the TDDFT-MD dynamics of the 77 K simulation. The total energy of each normal mode is indicated at 30, 60, 90 and 120 fs in panel (a–d), respectively. The four normal modes which pick up the largest amount of energy throughout the simulation are labelled (I), (II), (III) and (IV) with mode numbers of 420, 471, 149 and 153 and corresponding frequencies 415, 400, 214 and 215 cm−1, respectively. The displacement eigenvectors associated with these normal modes are depicted by the blue arrows shown in e. On the basis of the frequencies and vibrational motion shown in e, out-of-plane oscillations of S atoms for (I) and (II), these two phonon modes clearly correspond to the A1g Raman mode of the MoS2 layer and A1g Raman mode of the WS2 layer, respectively. Note that the A1g mode is one of the most prominent Raman modes in TMDs32,45, indicating strong electron-phonon coupling for A1g phonons. Similarly, the modes labelled (III) and (IV) correspond to longitudinal acoustic (LA) phonons with non-zero wavevector. Notably, phonons from the LA branch at the M point have been found to exhibit appreciable signals in the resonant Raman scattering, also suggesting strong electron-phonon coupling for LA phonons31.

