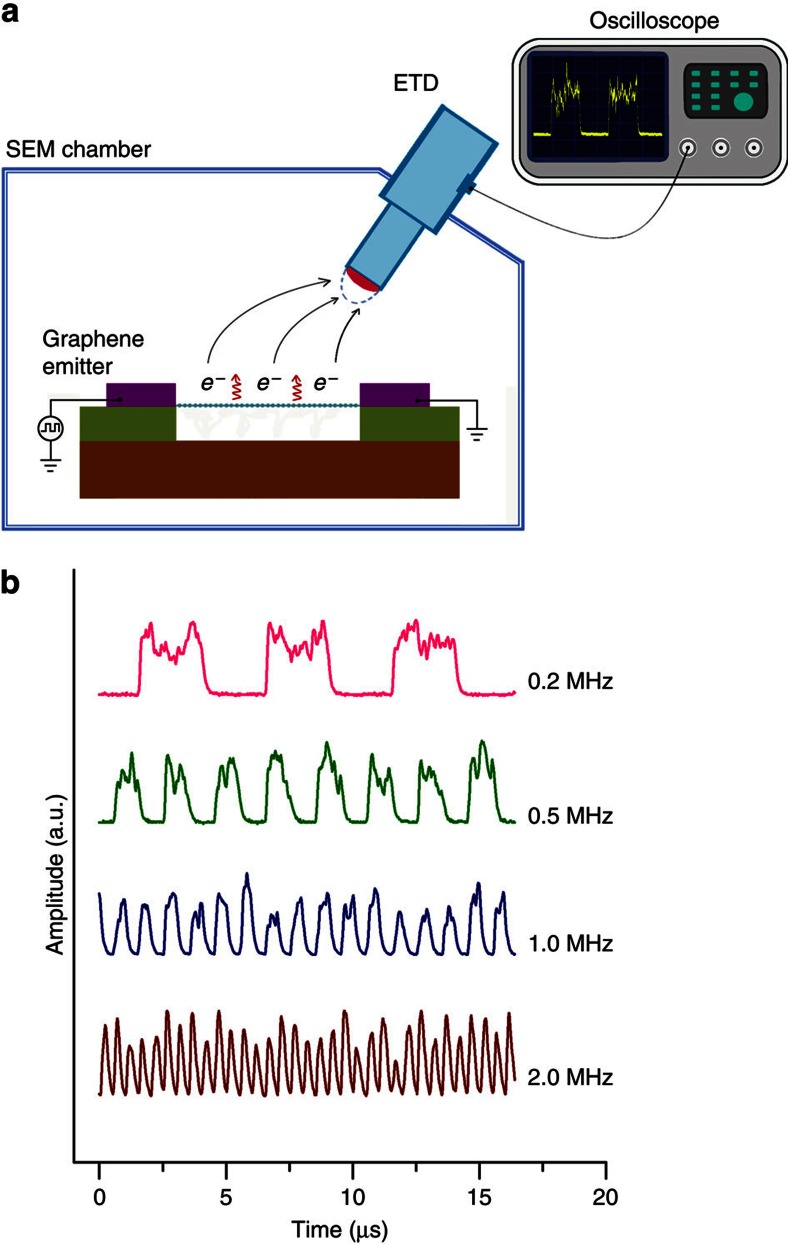
Figure 3. Temporal response of a GME.
(a) A schematic drawing showing the measurement of the temporal response of a GME inside a SEM chamber. Electron emission from a GME is driven by a square wave voltage with the high and low voltage levels larger and smaller than the turn-on voltage of the GME, respectively. Electron emission is detected by the ETD of a SEM and recorded by an oscilloscope. (b) Output signals of ETD when electron emission from a GME is driven by a square wave voltage of different frequencies.

