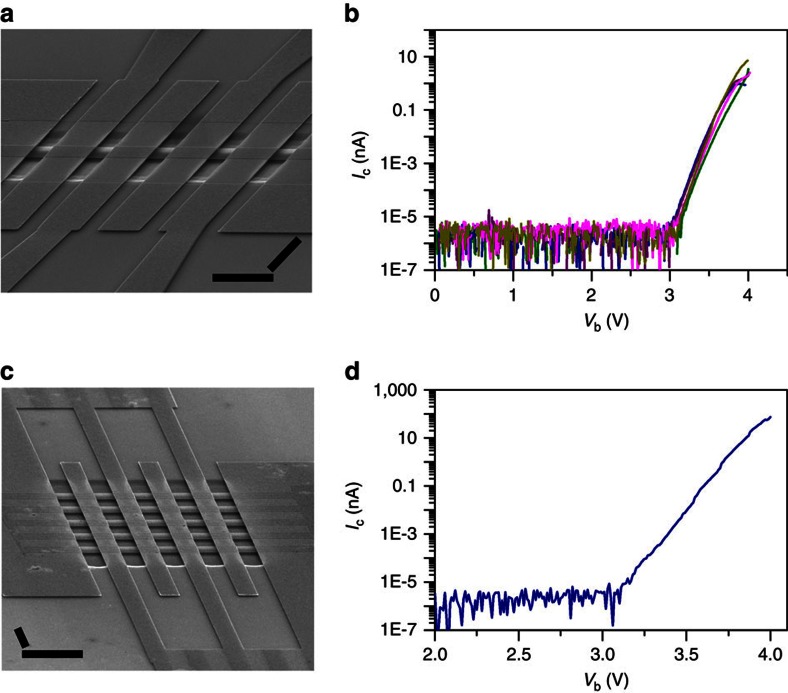
Figure 5. Electron emission performances of GME arrays.
(a) Tilted SEM image of a row of five GMEs having same dimensions. (b) Ic−Vb curves of individual GMEs in the array shown in a. They are displayed in sequence in blue, olive, purple, magenta and dark yellow, respectively, corresponding to the GMEs from left to right in a. (c) Tilted SEM image of a 5 × 5 parallel GME array connected by interdigital electrodes with each GME having same dimensions as those in a. (d) Ic−Vb curve of the array in c. Ic–Vb curves in b and d were measured at Vc=100 V and Vg=10 V. The scale bars in a and c are 5 μm.

