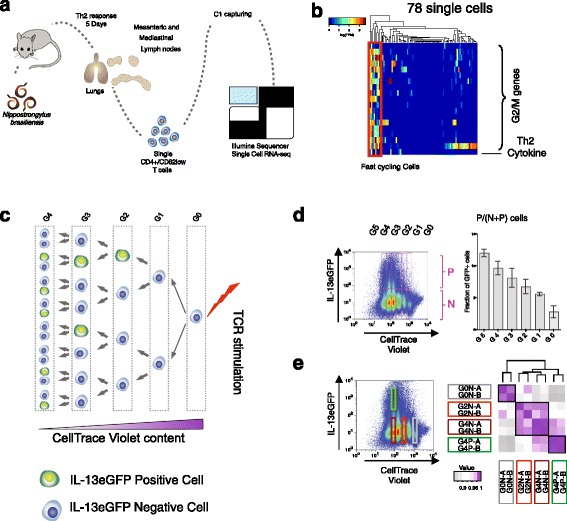
Fig. 1.

Th2 differentiation resolved by cell generation. a Overview of the experiment. CD3+/CD4+/CD62L- T helper cells were isolated from lungs, mesenteric and mediastinal lymph nodes of Nb-infected mice on day 5 post-infection. After cell capturing and cDNA generation with the C1 system, samples were sequenced with an Illumina Hi-seq Sequencer. b Seventy-eight single cells were clustered according to the expression of G2/M genes (logTPM) as a measure of cell cycle speed. TPM transcripts per millions. Three cells expressing IL4 clustered within the group of cells expressing high levels of G2/M genes (in the red box) (p value = 0.008, Fisher’s exact test). c Schematic representation of the division/differentiation process from a naïve cell to fully differentiated Th2 cells. The CellTrace Violet content is roughly equally distributed between daughter cells after each mitotic division. Cells expressing the Il13-eGFP Th2 differentiation marker are shown in green. TCR T-cell receptor. d Flow cytometry plot of CellTrace Violet versus Il13-eGFP differentiated Th2 cells at day 3.5. Consecutive generations (from G0 to G5) are visualized as pink gates. The upper gates are IL13-positive cells (P), and the lower gates contain IL13-negative cells (N). Ratio of GFP-P cells to the total number of cells per generation (average and standard deviation of three biological replicates). e Cells in the gates highlighted were sorted by FACS and profiled by mRNA-sequencing. Hierarchical clustering of the distance matrices between RNA expression profiles
