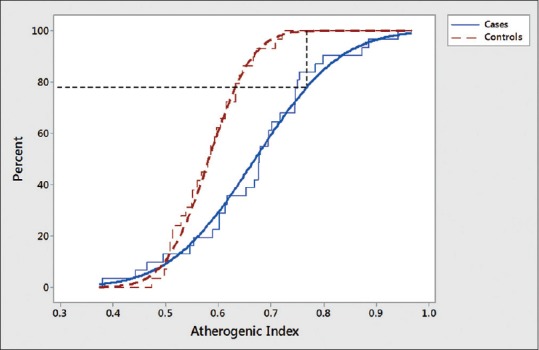
Figure 3.

Cumulative distribution function plots of atherogenic index in cases and controls (staircase curves show empirical cumulative distribution function from the observed data and smooth curves are lognormal cumulative distribution function fit of the observed data)
