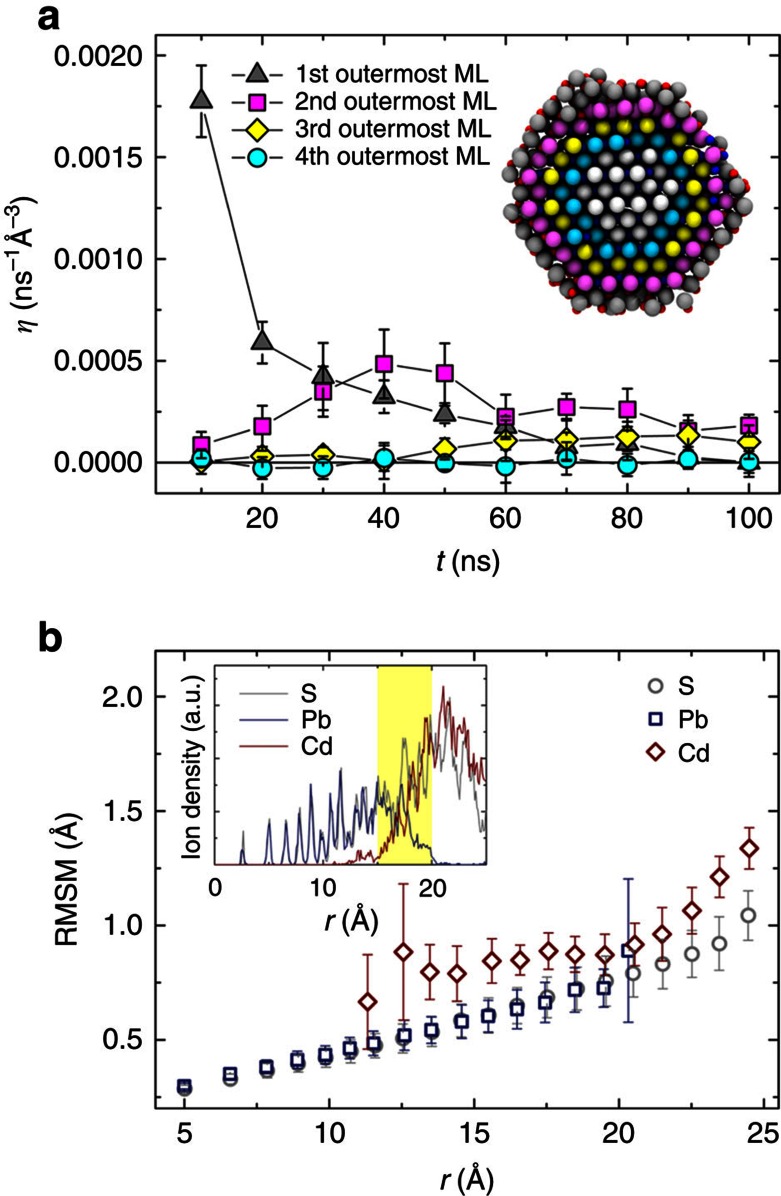
Figure 3. Exchange rate and atomic mobility analysis of Pb→Cd CE.
(a) Time evolution of the averaged volume-scaled exchange rate η (see Methods section) for the four outermost atomic MLs. Data were collected from 10 independent 100-ns MD simulations of a PbS NC at 550 K. The inset shows the final configuration of the RS-(110) section from one of the MD simulations. The S ions are coloured according to the colour code of the different outermost MLs. The small red and blue spheres are Cd and Pb, respectively. (b) Averaged RMSM (see Methods section) of S (grey circles), Pb (blue squares) and Cd (red diamonds) as a function of r (r is the distance between the ion and the centre of the NC). The inset shows the ion density as a function of r. The yellow region labels the CdxPb1−xS mixed phase domain between the PbS core and the CdS shell. Data were sampled during the last 100 ps of the ten independent 100-ns MD simulations.

