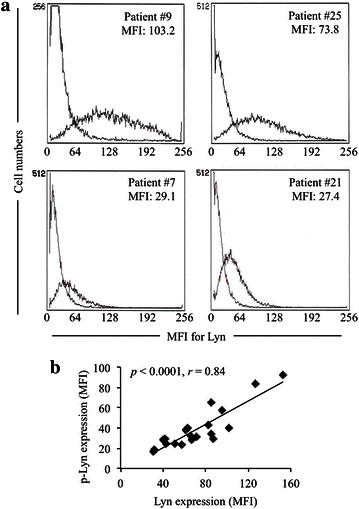
Fig. 1.

Representative flow cytometry histograms of Lyn expression and a positive correlation between the expression levels of total and phosphorylated Lyn in primary AML blast cells from patients. The expression levels of Lyn in primary AML cells were analyzed and presented as histograms plotted by flow cytometry as described in “Methods” section. a Histograms show the high (patients #9 and #25) and low (patients #7 and #21) Lyn expression level in respective primary AML blast cells of individual patients. b A strong correlation between the expression levels of total and phosphorylated Lyn (p-Lyn). MFI mean fluorescence intensity
