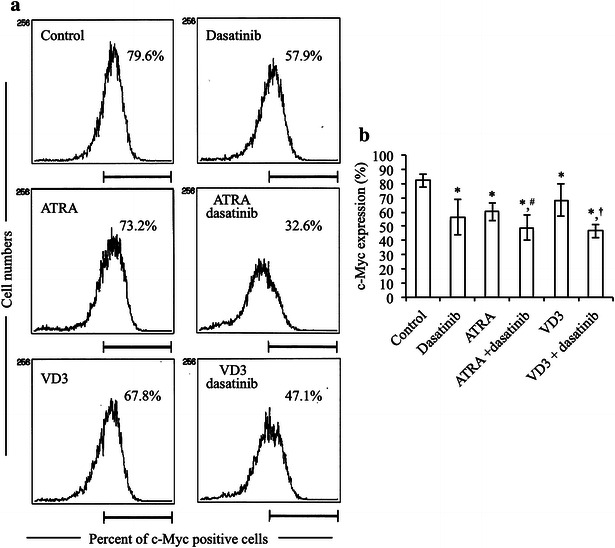
Fig. 4.

Potentiation of ATRA- or VD3-induced c-Myc downregulation by dasatinib in HL-60 cells. After treatment with 1 μM ATRA, 100 nM VD3, alone or in combination with 300 nM dasatinib, for 72 h, the alteration of c-Myc expression in HL-60 cells was examined by intracytoplasmic staining using flow cytometry as described in “Methods” section. The relative expression level of c-Myc is shown as the mean fluorescence intensity (MFI). a Representative histogram rofiles are shown. b The relative expression level of c-Myc was calculated based on flow cytometry profiles shown in (a). Six independent experiments were carried out and results are shown as mean ± SD. *p < 0.05 vs. control; # p < 0.05 vs. ATRA; † p < 0.05 vs. VD3
