
Fig. 4.
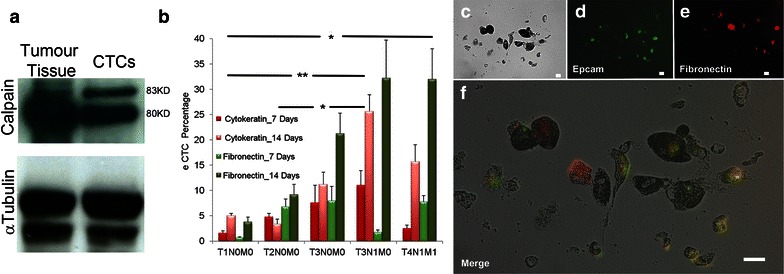
Phenotypic characterization of eCTCs. a Calpain expression was compared in the same patient between CTCs (collected before surgical treatment) and correspondent tumour tissue sample collected during surgical resection. Control α-tubulin immunoblot confirmed equal loading. b Bar graph displayed eCTCs dynamic phenotypic changes in different stage of tumour (according to Tumor-Node-Metastasis, UICC-2009) (data are presented as mean ± standard deviation). Multiple comparison procedures pairwise showed significant differences between advanced (T3N1M0, T4N1M1) versus localized colon cancer stages (T1N0M0, T2N0M0). *p < 0.05, **p ≤ 0.01. c–f, immunofluorescence characterization of eCTCs for epithelial (Epcam, green channel) and mesenchymal (Fibronectin, red channel) antigens expressions. Their co-expression on cell’s surface revealed the EMT phenotype (merged color image). Scale bars 50 μm