
Fig. 7.
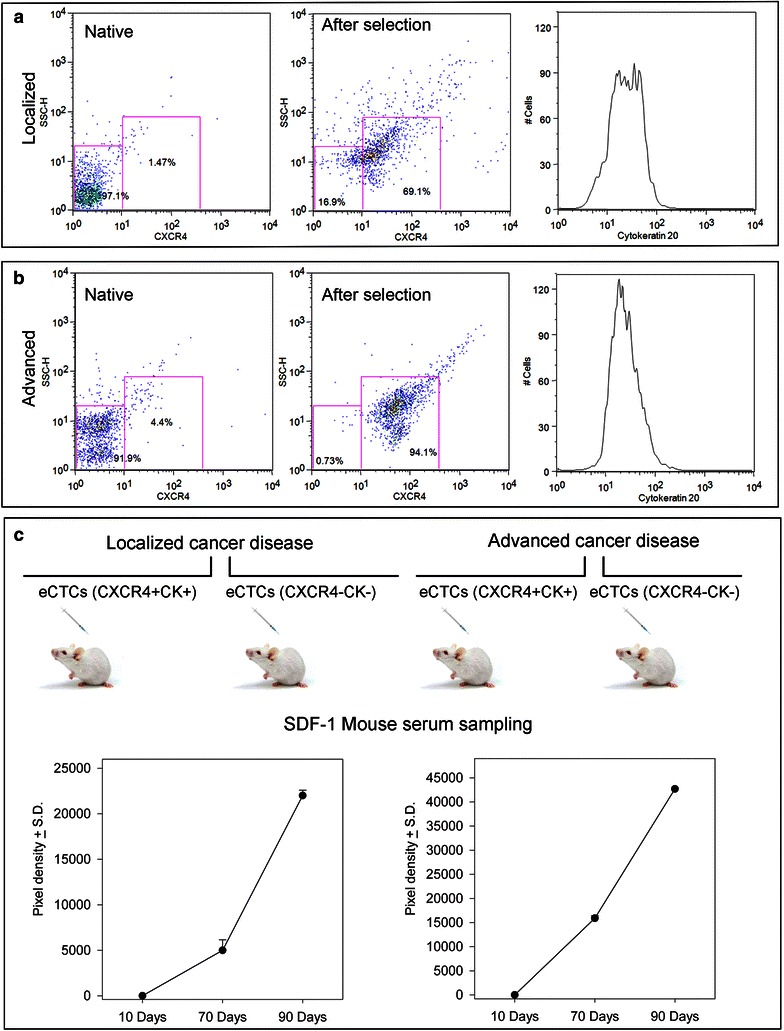
Characterization of injected circulating cancer cells and survival trend. Representative dot plots show cell surface CXCR4 expression (x-axis) versus side scatter (SSC; y-axis) of pre-sorting (naive) and post-sort tumour cellular suspensions (a, b). After cell sorting the post-sorting cell population was evaluated for the expression of CK20 reported in histograms (right panels) respectively in localized (a) and advanced (b) colon cancer. c Trends of SDF-1 (data are represented as mean ± standard deviation) in serum of mice injected with eCTCs-CXCR4posCKpos segment were reported. In mice injected with eCTCs-CXCR4posCKpos derived from localized colon case the levels of serum SDF-1 shows a sharp increase which peaking at days ninety (left panel). In mice injected with eCTCs-CXCR4posCKpos derived from advanced colon case the levels of serum SDF-1 show a steeper trend of the curve (right panel)