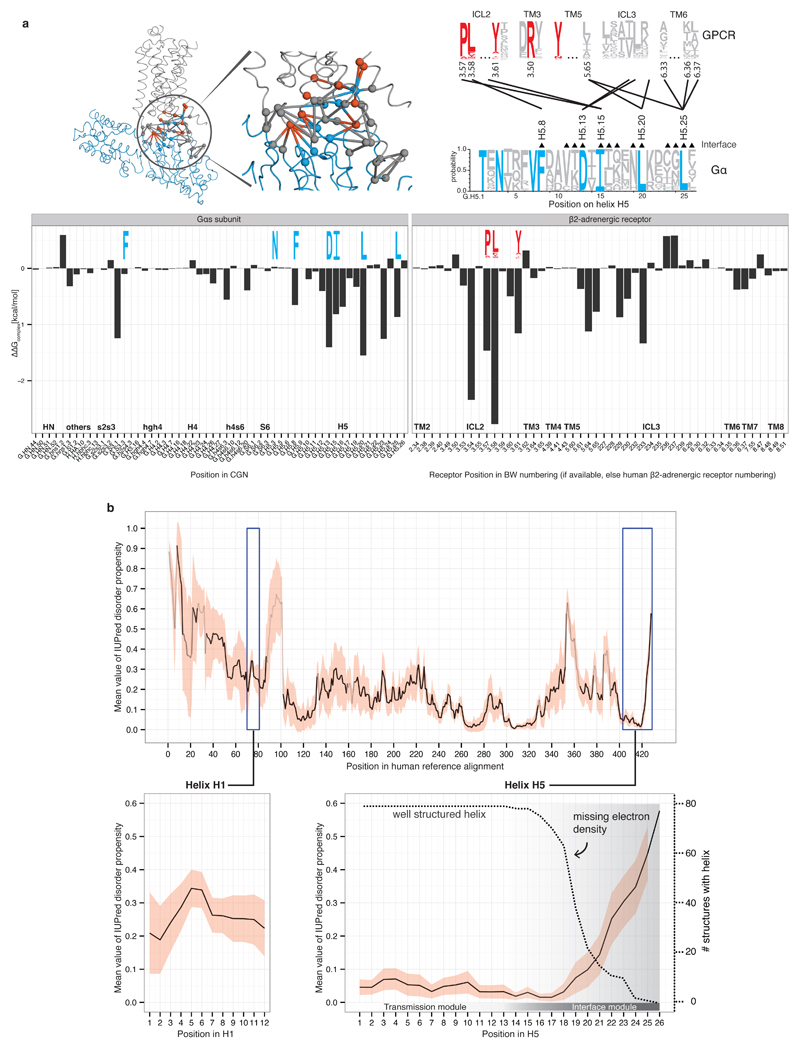
Extended Figure 2. Energy estimation of the GPCR-Gα residue contributions and Gα disorder propensity.
a, Energy contribution of single interface residues to the Gαs-β2AR complex calculated with FoldX (T = 298K, pH = 7.0, ion strength = 0.05M). Conserved Gα residues (blue sequence logo) that were identified to form receptor-Gα inter-protein contacts with conserved GPCR residues (red sequence logo) are shown. The contact network between residues of the β2AR and Gαs is shown (red, conserved receptor residue; blue, conserved Gα residue; grey, variable residues; spheres represent Cα positions and links represent non-covalent contact. b, Consensus disorder plot for all Gα proteins. The mean value of the disorder propensity of all full-length Gα sequences (561 sequences) from all 16 Gα types is shown as a black line, the standard deviation at each position is shown as light red ribbon. The color tone of the line indicates the number of gaps at an aligned position (black=no gaps). The left inset shows the disorder propensity of H1. The right inset highlights that H5 is highly structured in its N-terminus, and has increased disorder propensity towards the C-terminus, which is in agreement with the missing electron density in the 79 structures.

