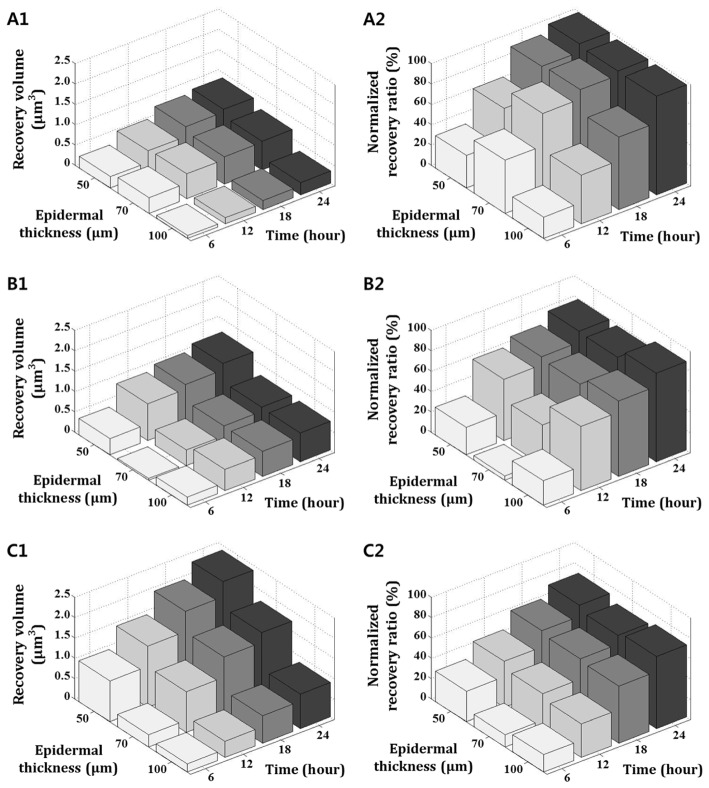
Fig. 9.
Comparison of the change of recovery volume and normalized recovery ratio according to a variation of laser exposure power and epidermal thickness. The recovery volume indicates the difference between initial and the volumes which were measured every 6 hours. Similarly, the normalized recovery ratio was measured every 6 hours and indicates the extent of the wound that was recovered from the initial wound. (A1) The recovery volume and (A2) the recovery ratio of after 40 mJ/cm2 laser exposure, (B1) and (B2) after 80 mJ/cm2 laser exposure, (C1) and (C2) after 120 mJ/cm2 laser exposure.

