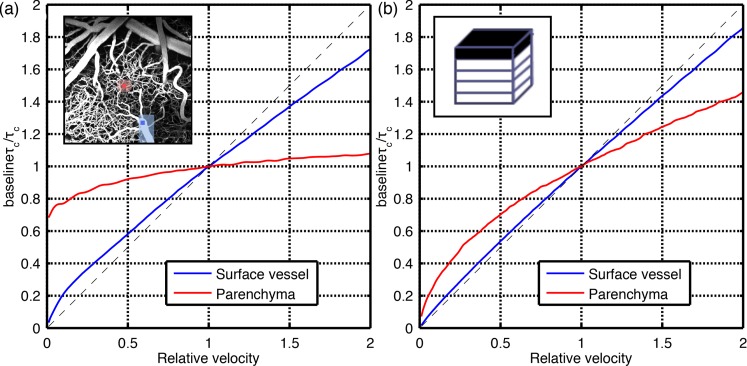
Fig. 5.
The relationship between and particle velocity in a representative surface vessel and parenchyma ROIs. The slope represents the sensitivity function S(r) and the dotted line represents a sensitivity of 1. The plot in (a) shows targeted perturbation regions: the velocity in the entire surface vessel was adjusted for the surface vessel ROI, and a 25 μm radius cylinder was perturbed for the parenchyma ROI. In (b) the top 200 μm of the geometry was perturbed for both ROI.

