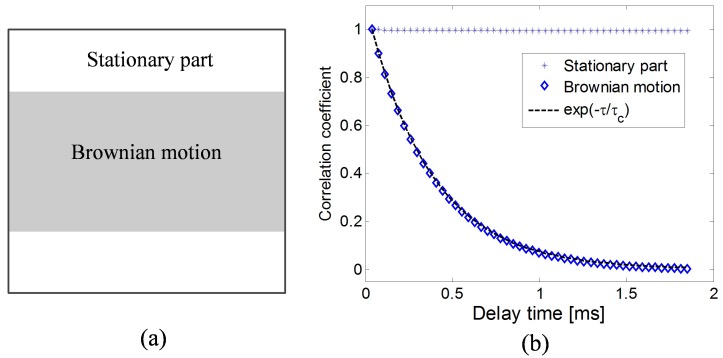
Fig. 4.
(a) The flow model. (b) The simulated correlation for the two regions as a function of the frame index. The asterisks mark the correlation coefficients of the stationary area with input values equal to 1; the diamonds represent the correlation coefficients in the Brownian motion region, and the line is a negative exponential function.

