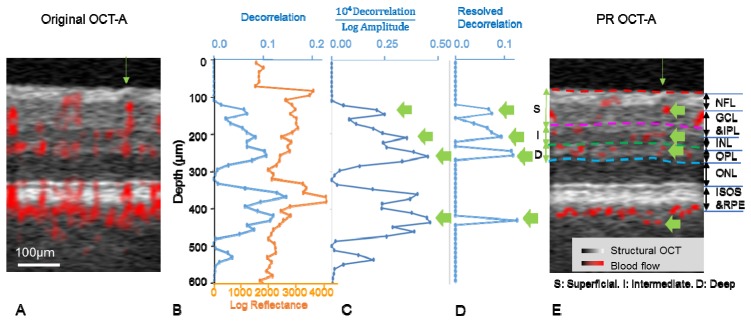
Fig. 2.
Illustration of projection-resolved (PR) OCT-A algorithm. (A) Composite cross-sectional OCT-A before projection suppression. This 0.23 mm wide example is taken from the parafoveal region. (B) Original decorrelation and log amplitude values of the A-line pointed to by the green arrow in A. (C) Decorrelation normalized by log amplitude according to Eq. (1). Four successively higher peaks (green arrows) on this plot represent in situ flow in real vessels. (D) Decorrelations plot after clean up by the PR algorithm – decorrelation values outside the successive peaks represented projection artifacts and were set to zero (Eq. (3). (E) Composite cross-sectional OCT-A after clean-up of projection artifacts using the PR algorithm. The green arrows in pointed at the same voxels identified as real vessels in C and D. Note that 4 vessels co-existing along the same A-line could be identified on the PR OCT-A, and their axial positions could be pinpointed. The PR OCT-A of the macula shows 3 distinct vascular plexuses in the inner retina - superficial, intermediate, and deep – as has been described in previous histological studies [23].

