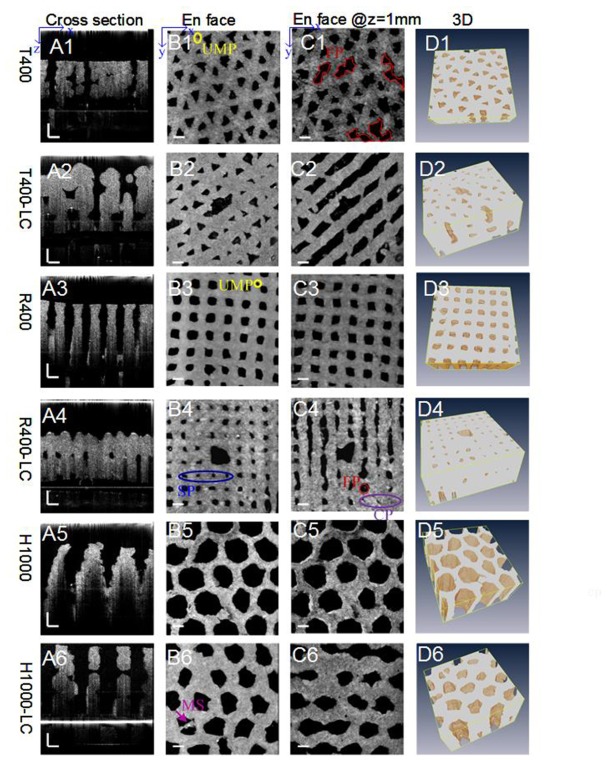
Fig. 5.
(A1–A6) Cross-sectional and (B1–B6) en face OCT images at the surface of the hydrogel scaffolds fabricated using different design parameters. (C1-C6) en face images were taken at a depth of 1 mm. (D1–D6) 3D observation of the hydrogel polymer matrix segmented from OCT images (see Visualization 1 (9.7MB, MOV) ). 3D images were analyzed using a depth range of 0–2mm. SP, the shrinkage of the superficial pores; FP, fused pores; UMP, undefined micropores; MS, the stacking of excessive materials; CP, closed pores. Scale bars are all 500 μm.

